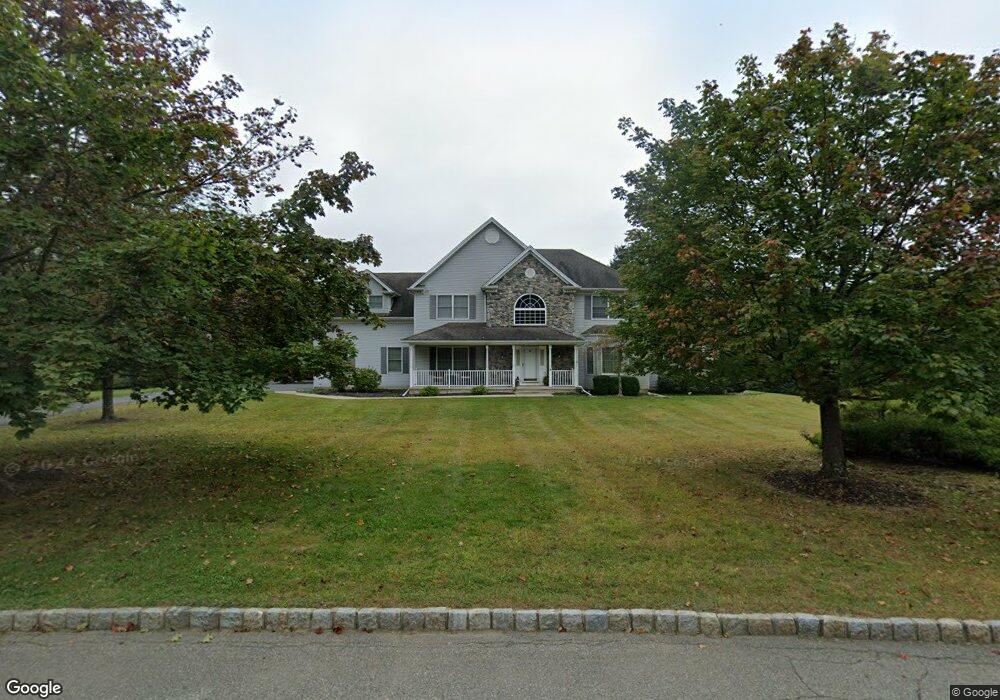
4 Noa Ct Hackettstown, NJ 07840
Estimated Value: $843,991 - $917,000
Studio
--
Bath
3,286
Sq Ft
$268/Sq Ft
Est. Value
About This Home
This home is located at 4 Noa Ct, Hackettstown, NJ 07840 and is currently estimated at $881,748, approximately $268 per square foot. 4 Noa Ct is a home located in Morris County with nearby schools including Mt Olive Middle School and Mount Olive High School.
Ownership History
Date
Name
Owned For
Owner Type
Purchase Details
Closed on
May 6, 2004
Sold by
Humme Ralph
Bought by
Smith Dan and Smith Francine
Current Estimated Value
Purchase Details
Closed on
Jun 26, 2000
Sold by
Molnar Michael A and Molnar Shirley M
Bought by
Humme Ralph and Humme Sarah
Home Financials for this Owner
Home Financials are based on the most recent Mortgage that was taken out on this home.
Original Mortgage
$344,000
Interest Rate
6.12%
Mortgage Type
Stand Alone First
Purchase Details
Closed on
Nov 24, 1998
Sold by
Abd New Jersey Inc
Bought by
Molnar Michael A and Molnar Shirley M
Home Financials for this Owner
Home Financials are based on the most recent Mortgage that was taken out on this home.
Original Mortgage
$268,000
Interest Rate
5%
Create a Home Valuation Report for This Property
The Home Valuation Report is an in-depth analysis detailing your home's value as well as a comparison with similar homes in the area
Home Values in the Area
Average Home Value in this Area
Purchase History
| Date | Buyer | Sale Price | Title Company |
|---|---|---|---|
| Smith Dan | $575,000 | -- | |
| Humme Ralph | $429,000 | -- | |
| Molnar Michael A | $335,000 | -- |
Source: Public Records
Mortgage History
| Date | Status | Borrower | Loan Amount |
|---|---|---|---|
| Previous Owner | Humme Ralph | $344,000 | |
| Previous Owner | Molnar Michael A | $268,000 |
Source: Public Records
Tax History
| Year | Tax Paid | Tax Assessment Tax Assessment Total Assessment is a certain percentage of the fair market value that is determined by local assessors to be the total taxable value of land and additions on the property. | Land | Improvement |
|---|---|---|---|---|
| 2025 | $18,436 | $529,000 | $168,800 | $360,200 |
| 2024 | $17,388 | $529,000 | $168,800 | $360,200 |
Source: Public Records
Map
Nearby Homes
- 5 Tracey Ln
- 20 Mine Hill Rd
- 18 Old Wolfe Rd
- 8 Myrtle Ave
- 2 Brock Ln
- 20 Amos Way
- 62 Sowers Dr
- 88 Sowers Dr
- 23 Manor House Rd
- 25 Manor House Rd
- 38 Saunders Ln
- 96 Winding Hill Dr
- 15 Dorset Dr
- 32 Nancy Terrace
- 50 Drakestown Rd
- 14 Kim Ln
- 40 Helms Mill Rd
- 108 Mount Olive Rd
- 9 Prospect Ave
- 117 Naughright Rd
Your Personal Tour Guide
Ask me questions while you tour the home.