Estimated Value: $1,399,000 - $1,846,000
6
Beds
5
Baths
3,398
Sq Ft
$478/Sq Ft
Est. Value
About This Home
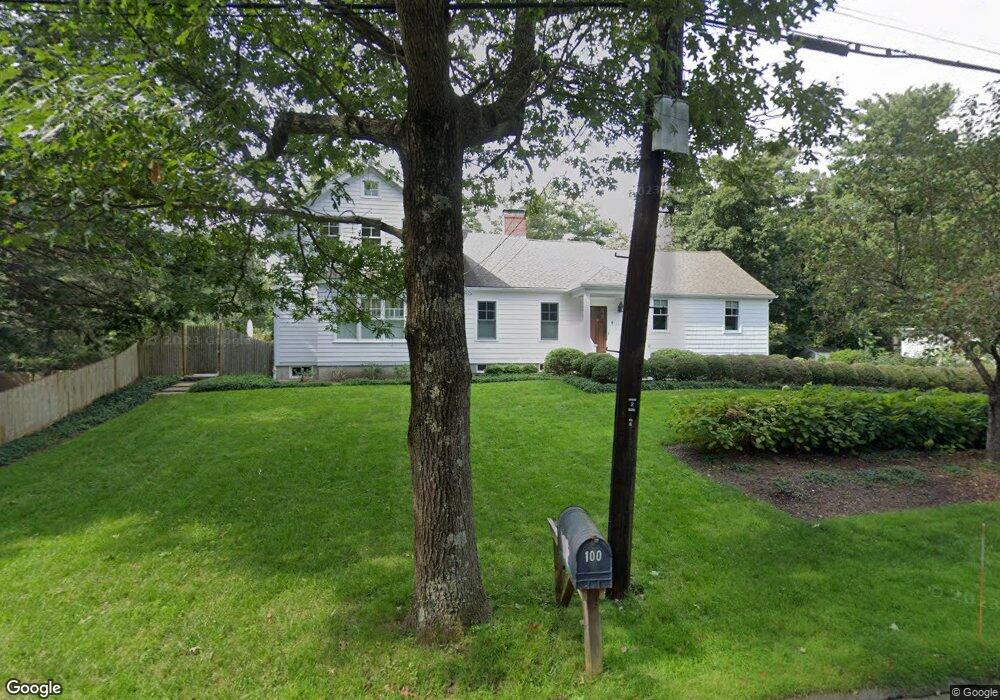
This home is located at 4 Oakley Rd, Dover, MA 02030 and is currently estimated at $1,624,094, approximately $477 per square foot. 4 Oakley Rd is a home located in Norfolk County with nearby schools including Chickering Elementary School, Dover-Sherborn Regional Middle School, and Dover-Sherborn Regional High School.
Ownership History
Date
Name
Owned For
Owner Type
Purchase Details
Closed on
Mar 1, 2016
Sold by
Mitchell Kathleen M
Bought by
4 Oakley Road Rt and Hershberg Steven D
Current Estimated Value
Purchase Details
Closed on
Dec 7, 2006
Sold by
Hershberg Steven D
Bought by
Mitchell Kathleen M
Purchase Details
Closed on
Sep 15, 1998
Sold by
Cohen Philip S and Cohen Candice M
Bought by
Hershberg Steven D
Home Financials for this Owner
Home Financials are based on the most recent Mortgage that was taken out on this home.
Original Mortgage
$105,000
Interest Rate
6.92%
Mortgage Type
Purchase Money Mortgage
Purchase Details
Closed on
Jan 17, 1997
Sold by
Russell Tr C Earl
Bought by
Cohen Philip S and Cohen Candice M
Home Financials for this Owner
Home Financials are based on the most recent Mortgage that was taken out on this home.
Original Mortgage
$271,980
Interest Rate
7.36%
Mortgage Type
Purchase Money Mortgage
Create a Home Valuation Report for This Property
The Home Valuation Report is an in-depth analysis detailing your home's value as well as a comparison with similar homes in the area
Home Values in the Area
Average Home Value in this Area
Purchase History
| Date | Buyer | Sale Price | Title Company |
|---|---|---|---|
| 4 Oakley Road Rt | -- | -- | |
| Mitchell Kathleen M | -- | -- | |
| Hershberg Steven D | $336,500 | -- | |
| Cohen Philip S | $302,200 | -- |
Source: Public Records
Mortgage History
| Date | Status | Borrower | Loan Amount |
|---|---|---|---|
| Previous Owner | Hershberg Steven D | $105,000 | |
| Previous Owner | Hershberg Steven D | $277,000 | |
| Previous Owner | Cohen Philip S | $271,980 |
Source: Public Records
Tax History
| Year | Tax Paid | Tax Assessment Tax Assessment Total Assessment is a certain percentage of the fair market value that is determined by local assessors to be the total taxable value of land and additions on the property. | Land | Improvement |
|---|---|---|---|---|
| 2025 | $15,245 | $1,352,700 | $620,600 | $732,100 |
| 2024 | $14,120 | $1,288,300 | $601,600 | $686,700 |
| 2023 | $13,752 | $1,128,100 | $535,100 | $593,000 |
| 2022 | $12,924 | $1,040,600 | $516,100 | $524,500 |
| 2021 | $13,179 | $1,022,400 | $516,100 | $506,300 |
| 2020 | $13,128 | $1,022,400 | $516,100 | $506,300 |
| 2019 | $13,220 | $1,022,400 | $516,100 | $506,300 |
| 2018 | $11,996 | $934,300 | $456,100 | $478,200 |
| 2017 | $11,877 | $910,100 | $418,100 | $492,000 |
| 2016 | $11,722 | $910,100 | $418,100 | $492,000 |
| 2015 | $11,293 | $889,200 | $397,200 | $492,000 |
Source: Public Records
Map
Nearby Homes
Your Personal Tour Guide
Ask me questions while you tour the home.