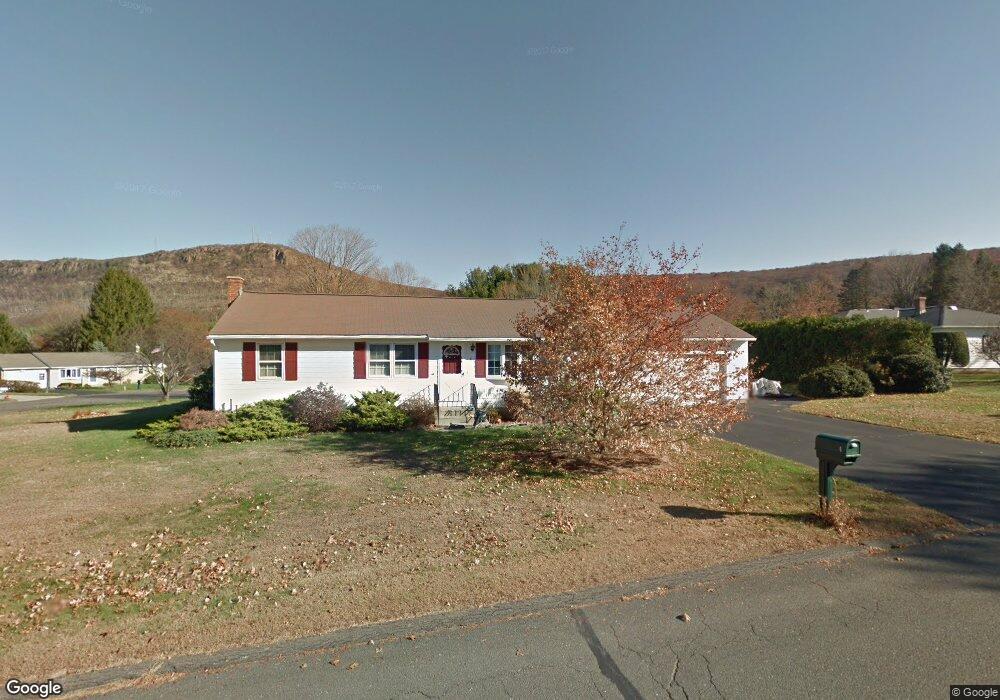
4 Overlook Dr Easthampton, MA 01027
Estimated Value: $395,000 - $427,000
3
Beds
3
Baths
1,328
Sq Ft
$310/Sq Ft
Est. Value
About This Home
This home is located at 4 Overlook Dr, Easthampton, MA 01027 and is currently estimated at $411,504, approximately $309 per square foot. 4 Overlook Dr is a home located in Hampshire County with nearby schools including Easthampton High School, Calvary Baptist Christian School, and Tri-County Schools.
Ownership History
Date
Name
Owned For
Owner Type
Purchase Details
Closed on
Apr 23, 2018
Sold by
Gieryk Jean M
Bought by
Gieryk Allyn J and Geryk Steven J
Current Estimated Value
Purchase Details
Closed on
Aug 31, 1999
Sold by
Thomas V Washington Nt and Washington Christine
Bought by
Gieryk Jean M
Home Financials for this Owner
Home Financials are based on the most recent Mortgage that was taken out on this home.
Original Mortgage
$70,000
Interest Rate
7.53%
Mortgage Type
Purchase Money Mortgage
Create a Home Valuation Report for This Property
The Home Valuation Report is an in-depth analysis detailing your home's value as well as a comparison with similar homes in the area
Home Values in the Area
Average Home Value in this Area
Purchase History
| Date | Buyer | Sale Price | Title Company |
|---|---|---|---|
| Gieryk Allyn J | -- | -- | |
| Gieryk Jean M | $140,000 | -- |
Source: Public Records
Mortgage History
| Date | Status | Borrower | Loan Amount |
|---|---|---|---|
| Previous Owner | Gieryk Jean M | $70,000 | |
| Previous Owner | Gieryk Jean M | $70,000 | |
| Previous Owner | Gieryk Jean M | $50,000 | |
| Previous Owner | Gieryk Jean M | $25,000 |
Source: Public Records
Tax History Compared to Growth
Tax History
| Year | Tax Paid | Tax Assessment Tax Assessment Total Assessment is a certain percentage of the fair market value that is determined by local assessors to be the total taxable value of land and additions on the property. | Land | Improvement |
|---|---|---|---|---|
| 2025 | $4,801 | $351,200 | $119,000 | $232,200 |
| 2024 | $4,633 | $341,700 | $115,500 | $226,200 |
| 2023 | $3,512 | $239,700 | $91,000 | $148,700 |
| 2022 | $3,962 | $239,700 | $91,000 | $148,700 |
| 2021 | $4,334 | $247,100 | $91,000 | $156,100 |
| 2020 | $4,257 | $239,700 | $91,000 | $148,700 |
| 2019 | $3,567 | $230,700 | $91,000 | $139,700 |
| 2018 | $3,419 | $213,700 | $85,900 | $127,800 |
| 2017 | $3,336 | $205,800 | $82,500 | $123,300 |
| 2016 | $3,464 | $222,200 | $82,500 | $139,700 |
| 2015 | $3,366 | $222,200 | $82,500 | $139,700 |
Source: Public Records
Map
Nearby Homes