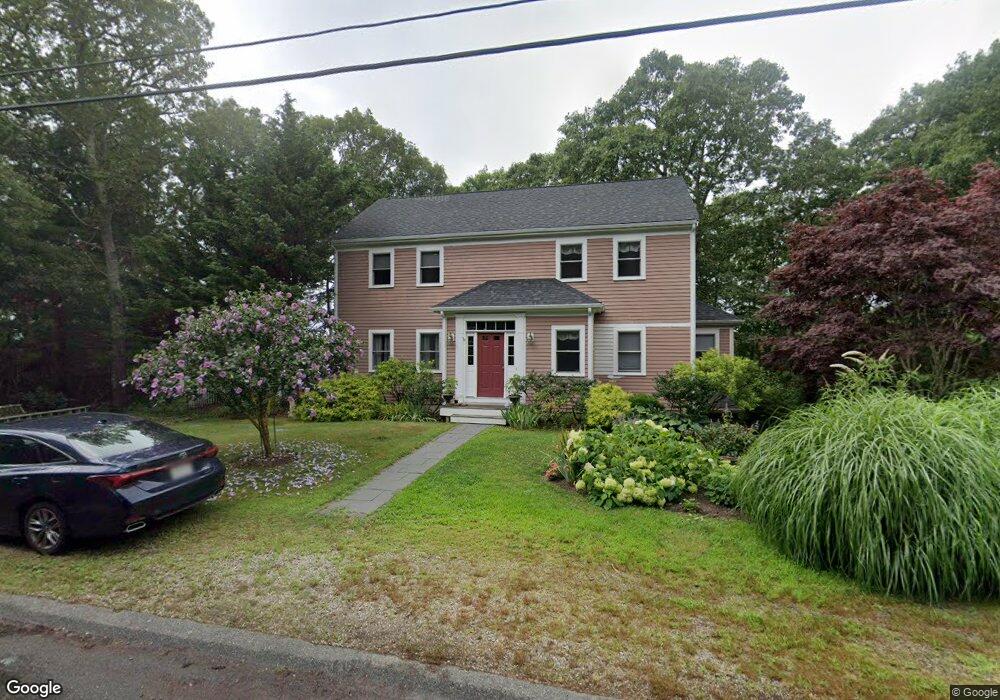
4 Paulinda Rd Pocasset, MA 02559
Pocasset NeighborhoodEstimated Value: $732,000 - $890,000
3
Beds
3
Baths
1,801
Sq Ft
$452/Sq Ft
Est. Value
About This Home
This home is located at 4 Paulinda Rd, Pocasset, MA 02559 and is currently estimated at $813,490, approximately $451 per square foot. 4 Paulinda Rd is a home located in Barnstable County with nearby schools including Bourne High School, Cadence Academy Preschool - Bourne, and St Margaret Regional School.
Ownership History
Date
Name
Owned For
Owner Type
Purchase Details
Closed on
Nov 26, 2024
Sold by
Rinella Anthony A and Rinella Peggy A
Bought by
Rinella Ft and Rinella
Current Estimated Value
Purchase Details
Closed on
Aug 27, 2003
Sold by
Dexter James R and Dexter Michelle M
Bought by
Renella Anthony A and Renella Peggy A
Home Financials for this Owner
Home Financials are based on the most recent Mortgage that was taken out on this home.
Original Mortgage
$322,700
Interest Rate
5.69%
Mortgage Type
Purchase Money Mortgage
Purchase Details
Closed on
Aug 6, 2002
Sold by
Sawyer Builders Inc
Bought by
Dexter James R and Dexter Michelle M
Home Financials for this Owner
Home Financials are based on the most recent Mortgage that was taken out on this home.
Original Mortgage
$250,000
Interest Rate
6.64%
Mortgage Type
Purchase Money Mortgage
Purchase Details
Closed on
Apr 4, 2000
Sold by
Massey Marjorie E
Bought by
Sawyer Michael C and Sawyer Elizabeth A
Create a Home Valuation Report for This Property
The Home Valuation Report is an in-depth analysis detailing your home's value as well as a comparison with similar homes in the area
Home Values in the Area
Average Home Value in this Area
Purchase History
| Date | Buyer | Sale Price | Title Company |
|---|---|---|---|
| Rinella Ft | -- | None Available | |
| Rinella Ft | -- | None Available | |
| Renella Anthony A | $420,000 | -- | |
| Dexter James R | $135,000 | -- | |
| Sawyer Builders Inc | $102,500 | -- | |
| Sawyer Michael C | $47,000 | -- | |
| Renella Anthony A | $420,000 | -- | |
| Dexter James R | $135,000 | -- | |
| Sawyer Michael C | $47,000 | -- |
Source: Public Records
Mortgage History
| Date | Status | Borrower | Loan Amount |
|---|---|---|---|
| Previous Owner | Renella Anthony A | $322,700 | |
| Previous Owner | Dexter James R | $250,000 |
Source: Public Records
Tax History Compared to Growth
Tax History
| Year | Tax Paid | Tax Assessment Tax Assessment Total Assessment is a certain percentage of the fair market value that is determined by local assessors to be the total taxable value of land and additions on the property. | Land | Improvement |
|---|---|---|---|---|
| 2025 | $5,985 | $766,300 | $371,000 | $395,300 |
| 2024 | $5,802 | $723,500 | $353,300 | $370,200 |
| 2023 | $5,411 | $614,200 | $286,600 | $327,600 |
| 2022 | $5,214 | $516,700 | $253,700 | $263,000 |
| 2021 | $5,095 | $473,100 | $230,800 | $242,300 |
| 2020 | $4,986 | $464,200 | $228,600 | $235,600 |
| 2019 | $4,766 | $453,500 | $228,600 | $224,900 |
| 2018 | $4,579 | $434,400 | $217,800 | $216,600 |
| 2017 | $4,430 | $430,100 | $215,700 | $214,400 |
| 2016 | $4,048 | $398,400 | $189,600 | $208,800 |
| 2015 | $4,012 | $398,400 | $189,600 | $208,800 |
Source: Public Records
Map
Nearby Homes
- 6 Paulinda Rd
- 8 Bennets Neck Dr
- 7 Paulinda Rd
- 12 Bennets Neck Dr
- 6 Bennets Neck Dr
- 8 Paulinda Rd
- 14 Bennets Neck Dr
- 4 Bennets Neck Dr
- 10 Paulinda Rd
- 10 Peninsula Cir
- 11 Bennets Neck Dr
- 7 Bennets Neck Dr
- 12 Paulinda Rd
- 9 Bennets Neck Dr
- 3 Peninsula Cir
- 15 Bennets Neck Dr
- 5 Bennets Neck Dr
- 0 Peninsula Cir
- 18 Bennets Neck Dr
- 8 Peninsula Cir