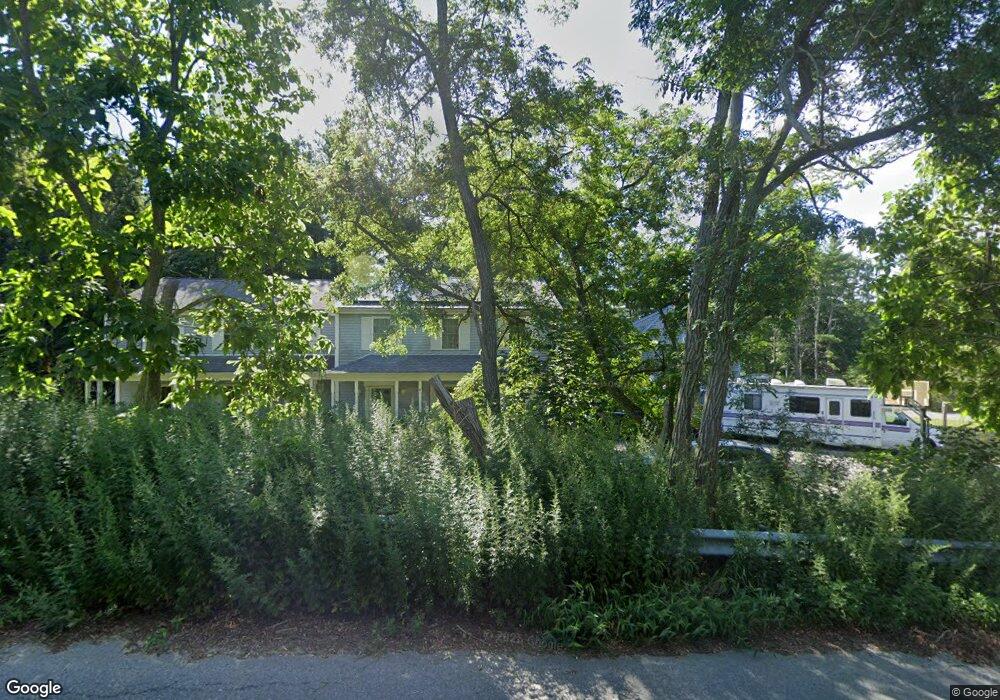
4 Pierceville Rd Unit A West Wareham, MA 02576
Estimated Value: $426,411 - $475,000
3
Beds
2
Baths
1,400
Sq Ft
$319/Sq Ft
Est. Value
About This Home
This home is located at 4 Pierceville Rd Unit A, West Wareham, MA 02576 and is currently estimated at $446,853, approximately $319 per square foot. 4 Pierceville Rd Unit A is a home located in Plymouth County.
Ownership History
Date
Name
Owned For
Owner Type
Purchase Details
Closed on
Dec 26, 2002
Sold by
Cornerstone Prop & Dev
Bought by
Morrison Thomas S and Morrison Stephanie A
Current Estimated Value
Home Financials for this Owner
Home Financials are based on the most recent Mortgage that was taken out on this home.
Original Mortgage
$183,255
Interest Rate
6.02%
Mortgage Type
Purchase Money Mortgage
Create a Home Valuation Report for This Property
The Home Valuation Report is an in-depth analysis detailing your home's value as well as a comparison with similar homes in the area
Home Values in the Area
Average Home Value in this Area
Purchase History
| Date | Buyer | Sale Price | Title Company |
|---|---|---|---|
| Morrison Thomas S | $192,900 | -- | |
| Morrison Thomas S | $192,900 | -- |
Source: Public Records
Mortgage History
| Date | Status | Borrower | Loan Amount |
|---|---|---|---|
| Open | Morrison Thomas S | $182,681 | |
| Closed | Morrison Thomas S | $183,255 |
Source: Public Records
Tax History
| Year | Tax Paid | Tax Assessment Tax Assessment Total Assessment is a certain percentage of the fair market value that is determined by local assessors to be the total taxable value of land and additions on the property. | Land | Improvement |
|---|---|---|---|---|
| 2025 | $3,237 | $310,700 | $0 | $310,700 |
| 2024 | $3,513 | $312,800 | $0 | $312,800 |
| 2023 | $3,150 | $271,200 | $0 | $271,200 |
| 2022 | $3,150 | $239,000 | $0 | $239,000 |
| 2021 | $3,061 | $227,600 | $0 | $227,600 |
| 2020 | $3,018 | $227,600 | $0 | $227,600 |
| 2019 | $2,597 | $195,400 | $0 | $195,400 |
| 2018 | $2,609 | $191,400 | $0 | $191,400 |
| 2017 | $1,989 | $147,900 | $0 | $147,900 |
| 2016 | $2,001 | $147,900 | $0 | $147,900 |
| 2015 | $2,106 | $161,100 | $0 | $161,100 |
| 2014 | $2,913 | $226,700 | $0 | $226,700 |
Source: Public Records
Map
Nearby Homes
Your Personal Tour Guide
Ask me questions while you tour the home.