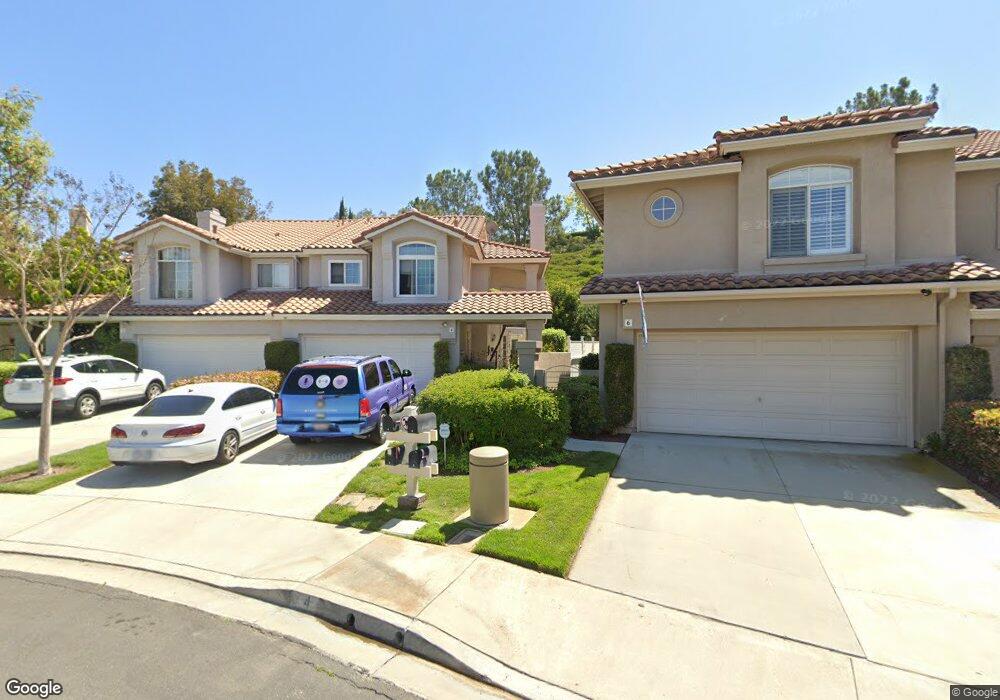
4 Pinyon Jay Ln Aliso Viejo, CA 92656
Estimated Value: $1,286,513 - $1,526,000
3
Beds
3
Baths
1,838
Sq Ft
$741/Sq Ft
Est. Value
About This Home
This home is located at 4 Pinyon Jay Ln, Aliso Viejo, CA 92656 and is currently estimated at $1,362,378, approximately $741 per square foot. 4 Pinyon Jay Ln is a home located in Orange County with nearby schools including Oak Grove Elementary School, Aliso Viejo Middle School, and Aliso Niguel High School.
Ownership History
Date
Name
Owned For
Owner Type
Purchase Details
Closed on
Feb 26, 2024
Sold by
Macdonald Laurie Dee
Bought by
Macdonald Laurie Dee
Current Estimated Value
Purchase Details
Closed on
Jul 23, 2019
Sold by
South Beach Mission
Bought by
Macdonald Lauren Mac
Purchase Details
Closed on
Sep 19, 2013
Sold by
Macdonald Lauren
Bought by
Love & Light Mission
Purchase Details
Closed on
Dec 2, 1999
Sold by
Christopher Nagelmann and Christopher Tamara
Bought by
Macdonald Lauren
Home Financials for this Owner
Home Financials are based on the most recent Mortgage that was taken out on this home.
Original Mortgage
$215,920
Interest Rate
7.68%
Purchase Details
Closed on
Oct 17, 1994
Sold by
Gettemy David C and Gettemy Kimberly J
Bought by
Nagelmann Christopher W and Nagelmann Tamara J
Home Financials for this Owner
Home Financials are based on the most recent Mortgage that was taken out on this home.
Original Mortgage
$187,150
Interest Rate
9.2%
Create a Home Valuation Report for This Property
The Home Valuation Report is an in-depth analysis detailing your home's value as well as a comparison with similar homes in the area
Home Values in the Area
Average Home Value in this Area
Purchase History
| Date | Buyer | Sale Price | Title Company |
|---|---|---|---|
| Macdonald Laurie Dee | -- | None Listed On Document | |
| Macdonald Lauren Mac | -- | None Available | |
| Love & Light Mission | -- | None Available | |
| Macdonald Lauren | $270,000 | -- | |
| Nagelmann Christopher W | $197,000 | Old Republic Title |
Source: Public Records
Mortgage History
| Date | Status | Borrower | Loan Amount |
|---|---|---|---|
| Previous Owner | Macdonald Lauren | $215,920 | |
| Previous Owner | Nagelmann Christopher W | $187,150 |
Source: Public Records
Tax History Compared to Growth
Tax History
| Year | Tax Paid | Tax Assessment Tax Assessment Total Assessment is a certain percentage of the fair market value that is determined by local assessors to be the total taxable value of land and additions on the property. | Land | Improvement |
|---|---|---|---|---|
| 2025 | $4,047 | $414,974 | $158,733 | $256,241 |
| 2024 | $4,047 | $406,838 | $155,621 | $251,217 |
| 2023 | $3,953 | $398,861 | $152,569 | $246,292 |
| 2022 | $3,874 | $391,041 | $149,578 | $241,463 |
| 2021 | $3,797 | $383,374 | $146,645 | $236,729 |
| 2020 | $3,757 | $379,443 | $145,141 | $234,302 |
| 2019 | $3,753 | $372,003 | $142,295 | $229,708 |
| 2018 | $3,679 | $364,709 | $139,505 | $225,204 |
| 2017 | $3,607 | $357,558 | $136,769 | $220,789 |
| 2016 | $3,516 | $350,548 | $134,088 | $216,460 |
| 2015 | $3,905 | $345,283 | $132,074 | $213,209 |
| 2014 | $3,828 | $550,000 | $369,432 | $180,568 |
Source: Public Records
Map
Nearby Homes
- 1 Nightingale Dr Unit 69
- 3217 Via Carrizo Unit A
- 3230 Via Carrizo Unit D
- 24 Bluebird Ln
- 3 Egret Ln
- 3241 San Amadeo Unit 1E
- 3241 San Amadeo Unit 2H
- 3241 San Amadeo Unit 1G
- 3211 Via Buena Vista Rd
- 15 Surfbird Ln
- 3243 San Amadeo Unit 2H
- 3205 Via Buena Vista Unit D
- 141 Nightingale Dr Unit 10
- 4001 Calle Sonora Unit 2B
- 4001 Calle Sonora Unit 3E
- 3190 Via Buena Vista Unit A
- 3003 Via Buena Vista Unit A
- 4006 Calle Sonora Oeste Unit 3F
- 3277 San Amadeo Unit A
- 71 Waxwing Ln Unit 109
- 6 Pinyon Jay Ln
- 2 Pinyon Jay Ln
- 8 Pinyon Jay Ln
- 13 Bob White Ln
- 10 Pinyon Jay Ln
- 11 Bob White Ln
- 12 Pinyon Jay Ln
- 9 Bob White Ln
- 8 Bob White Ln
- 14 Nutcracker Ln
- 14 Pinyon Jay Ln
- 16 Nutcracker Ln
- 12 Nutcracker Ln
- 6 Bob White Ln
- 10 Nutcracker Ln
- 13 Wigeon Ln
- 16 Pinyon Jay Ln
- 18 Nutcracker Ln
- 5 Bob White Ln
- 4 Bob White Ln Unit IN