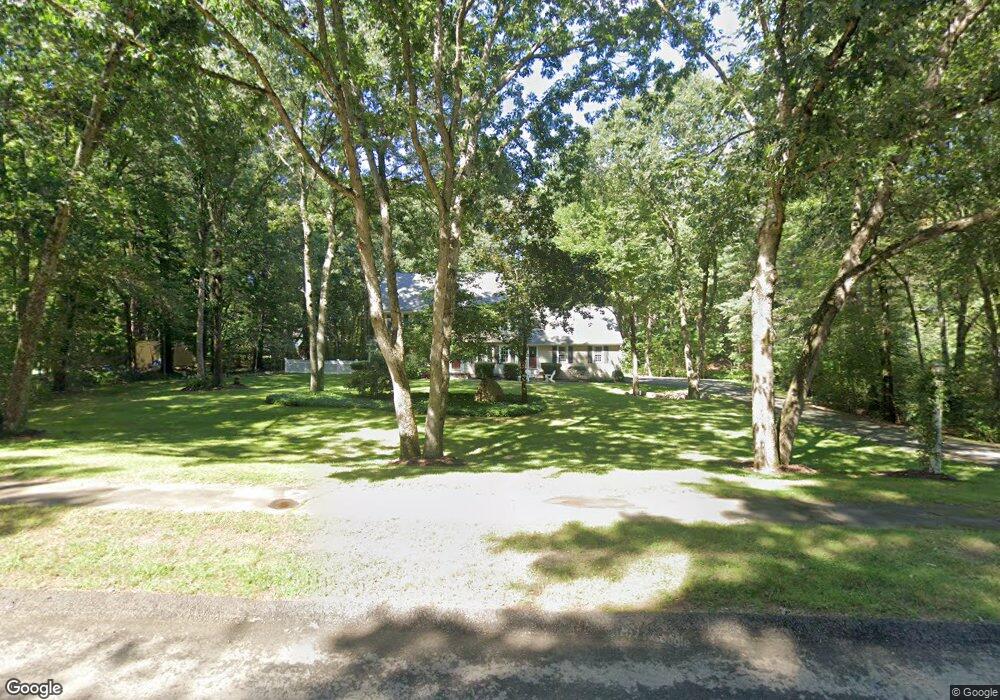
4 Quail Run Rd Norfolk, MA 02056
Estimated Value: $771,361 - $950,000
4
Beds
3
Baths
2,236
Sq Ft
$388/Sq Ft
Est. Value
About This Home
This home is located at 4 Quail Run Rd, Norfolk, MA 02056 and is currently estimated at $868,090, approximately $388 per square foot. 4 Quail Run Rd is a home located in Norfolk County with nearby schools including H. Olive Day School, Freeman-Kennedy School, and Woodside Montessori Academy.
Ownership History
Date
Name
Owned For
Owner Type
Purchase Details
Closed on
Jan 20, 2022
Sold by
Caragliano John and Caragliano Karen
Bought by
Karen L Caragliano Ret and Caragliano
Current Estimated Value
Purchase Details
Closed on
Mar 26, 1999
Sold by
Scheffler Richard H and Scheffler Madlyn J
Bought by
Caragliano John and Caragliano Karen
Home Financials for this Owner
Home Financials are based on the most recent Mortgage that was taken out on this home.
Original Mortgage
$190,000
Interest Rate
6.78%
Mortgage Type
Purchase Money Mortgage
Create a Home Valuation Report for This Property
The Home Valuation Report is an in-depth analysis detailing your home's value as well as a comparison with similar homes in the area
Home Values in the Area
Average Home Value in this Area
Purchase History
| Date | Buyer | Sale Price | Title Company |
|---|---|---|---|
| Karen L Caragliano Ret | -- | None Available | |
| Karen L Caragliano Ret | -- | None Available | |
| Caragliano John | $310,000 | -- |
Source: Public Records
Mortgage History
| Date | Status | Borrower | Loan Amount |
|---|---|---|---|
| Previous Owner | Caragliano John | $190,000 |
Source: Public Records
Tax History
| Year | Tax Paid | Tax Assessment Tax Assessment Total Assessment is a certain percentage of the fair market value that is determined by local assessors to be the total taxable value of land and additions on the property. | Land | Improvement |
|---|---|---|---|---|
| 2025 | $10,422 | $652,600 | $191,600 | $461,000 |
| 2024 | $9,945 | $638,700 | $193,500 | $445,200 |
| 2023 | $9,516 | $579,900 | $193,500 | $386,400 |
| 2022 | $8,756 | $481,100 | $181,900 | $299,200 |
| 2021 | $8,747 | $486,200 | $187,700 | $298,500 |
| 2020 | $9,309 | $499,400 | $188,400 | $311,000 |
| 2019 | $8,964 | $490,100 | $188,400 | $301,700 |
| 2018 | $8,776 | $471,300 | $197,500 | $273,800 |
| 2017 | $8,653 | $474,900 | $197,500 | $277,400 |
| 2016 | $8,581 | $474,600 | $203,000 | $271,600 |
| 2015 | $8,267 | $468,100 | $193,100 | $275,000 |
| 2014 | $7,814 | $448,300 | $193,100 | $255,200 |
Source: Public Records
Map
Nearby Homes
- 23 Fredrickson Rd
- 8 Ridgefield Rd
- 7 Keeney Pond Rd
- 0 W Birch Rd
- 16 Keeney Pond Rd
- 246 Forest Grove Ave
- 45 Meetinghouse Rd Unit 45
- 45 Joshua Rd
- 0 Toils End Rd
- 292 Main St
- 3 Elliot Mills Unit 2
- 6 Elliot Mills Unit 31
- 19 Waites Crossing
- 13 Waites Crossing
- 30 Weber Farm Rd Unit 30
- 11 Weber Farm Rd Unit 11
- 8 Weber Farm Rd Unit 8
- 11 Sharon Ave
- 50 Reed Fulton Ave Unit Lot 61
- 9 Sharon Ave
Your Personal Tour Guide
Ask me questions while you tour the home.