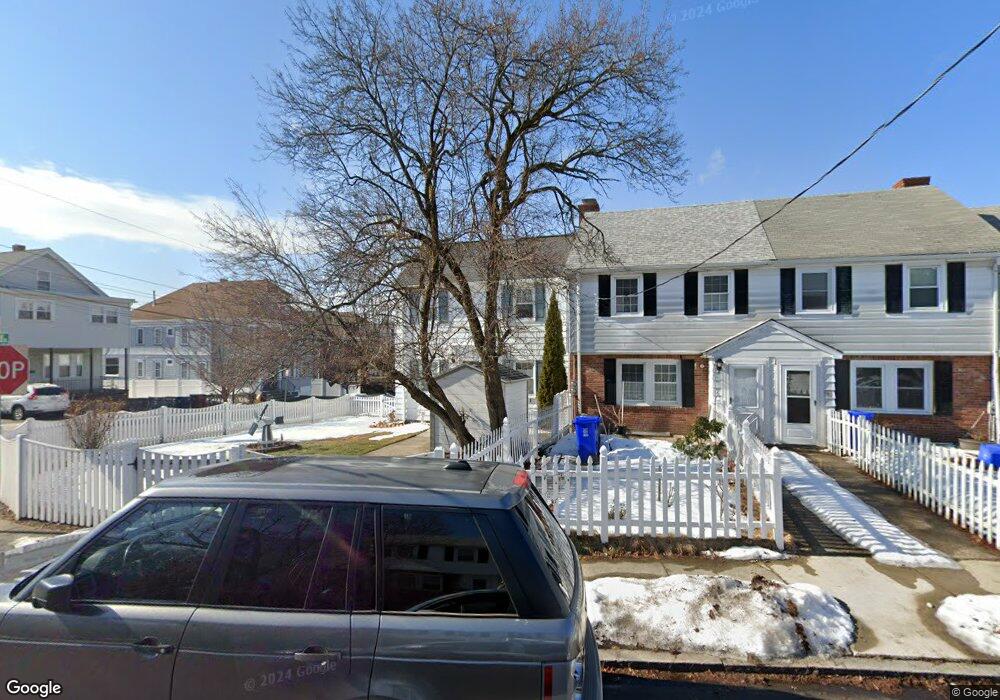
4 Regent Rd Malden, MA 02148
Bellrock NeighborhoodEstimated Value: $501,000 - $553,000
2
Beds
2
Baths
792
Sq Ft
$670/Sq Ft
Est. Value
About This Home
This home is located at 4 Regent Rd, Malden, MA 02148 and is currently estimated at $530,769, approximately $670 per square foot. 4 Regent Rd is a home located in Middlesex County with nearby schools including Malden High School, Mystic Valley Regional Charter School, and Cheverus Catholic School.
Ownership History
Date
Name
Owned For
Owner Type
Purchase Details
Closed on
Jun 19, 1991
Sold by
Joseph Roberto Est
Bought by
Muise Christine A
Current Estimated Value
Home Financials for this Owner
Home Financials are based on the most recent Mortgage that was taken out on this home.
Original Mortgage
$67,500
Interest Rate
9.37%
Mortgage Type
Purchase Money Mortgage
Create a Home Valuation Report for This Property
The Home Valuation Report is an in-depth analysis detailing your home's value as well as a comparison with similar homes in the area
Home Values in the Area
Average Home Value in this Area
Purchase History
| Date | Buyer | Sale Price | Title Company |
|---|---|---|---|
| Muise Christine A | $75,000 | -- |
Source: Public Records
Mortgage History
| Date | Status | Borrower | Loan Amount |
|---|---|---|---|
| Open | Muise Christine A | $75,000 | |
| Closed | Muise Christine A | $10,000 | |
| Closed | Muise Christine A | $70,000 | |
| Closed | Muise Christine A | $67,500 |
Source: Public Records
Tax History Compared to Growth
Tax History
| Year | Tax Paid | Tax Assessment Tax Assessment Total Assessment is a certain percentage of the fair market value that is determined by local assessors to be the total taxable value of land and additions on the property. | Land | Improvement |
|---|---|---|---|---|
| 2025 | $53 | $468,600 | $270,500 | $198,100 |
| 2024 | $5,258 | $449,800 | $255,400 | $194,400 |
| 2023 | $5,034 | $413,000 | $232,900 | $180,100 |
| 2022 | $4,674 | $378,500 | $210,400 | $168,100 |
| 2021 | $4,349 | $353,900 | $187,800 | $166,100 |
| 2020 | $4,381 | $346,300 | $181,400 | $164,900 |
| 2019 | $4,099 | $308,900 | $172,800 | $136,100 |
| 2018 | $3,861 | $274,000 | $142,700 | $131,300 |
| 2017 | $3,667 | $258,800 | $137,100 | $121,700 |
| 2016 | $3,519 | $232,100 | $125,800 | $106,300 |
| 2015 | $3,420 | $217,400 | $119,800 | $97,600 |
| 2014 | $3,400 | $211,200 | $108,900 | $102,300 |
Source: Public Records
Map
Nearby Homes
- 58 Regent Rd
- 16 Woodville St
- 67 Converse Ave Unit 69
- 80 Main St Unit 9
- 55 Clarendon St
- 171 Bell Rock St Unit 171
- 340 Main St
- 4 Cross St Unit 1
- 81 Everett St
- 100 Medford St
- 315 Main St
- 210 Hancock St
- 89 Judson St
- 39 Kinsman St
- 56 Valley St
- 25 Clark St
- 96 Clark St
- 17 Garland Ave
- 48 Cleveland Ave
- 74 Madison St