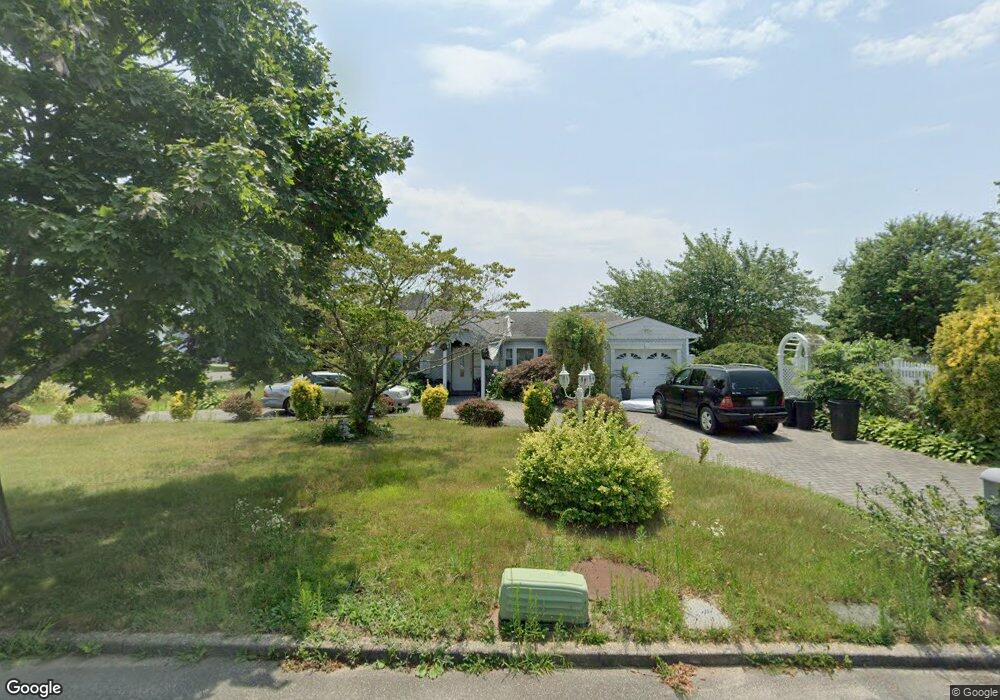
4 Reiben St Bellport, NY 11713
Estimated Value: $522,000 - $547,000
3
Beds
1
Bath
1,278
Sq Ft
$417/Sq Ft
Est. Value
About This Home
This home is located at 4 Reiben St, Bellport, NY 11713 and is currently estimated at $532,547, approximately $416 per square foot. 4 Reiben St is a home located in Suffolk County with nearby schools including Frank P Long Intermediate School, Bellport Middle School, and Bellport Senior High School.
Ownership History
Date
Name
Owned For
Owner Type
Purchase Details
Closed on
Jan 4, 2001
Sold by
Hud
Bought by
Montalvo Lydia N
Current Estimated Value
Home Financials for this Owner
Home Financials are based on the most recent Mortgage that was taken out on this home.
Original Mortgage
$107,315
Outstanding Balance
$39,883
Interest Rate
7.64%
Mortgage Type
FHA
Estimated Equity
$492,664
Purchase Details
Closed on
Aug 14, 1996
Sold by
Barrett Thomas and Barrett Doreen
Bought by
Lee Fredward and Wiley Diane L
Create a Home Valuation Report for This Property
The Home Valuation Report is an in-depth analysis detailing your home's value as well as a comparison with similar homes in the area
Home Values in the Area
Average Home Value in this Area
Purchase History
| Date | Buyer | Sale Price | Title Company |
|---|---|---|---|
| Montalvo Lydia N | $109,000 | Fidelity National Title Ins | |
| Lee Fredward | $104,000 | Chicago Title Insurance Co |
Source: Public Records
Mortgage History
| Date | Status | Borrower | Loan Amount |
|---|---|---|---|
| Open | Montalvo Lydia N | $107,315 |
Source: Public Records
Tax History Compared to Growth
Tax History
| Year | Tax Paid | Tax Assessment Tax Assessment Total Assessment is a certain percentage of the fair market value that is determined by local assessors to be the total taxable value of land and additions on the property. | Land | Improvement |
|---|---|---|---|---|
| 2024 | $7,739 | $2,035 | $300 | $1,735 |
| 2023 | $7,739 | $2,035 | $300 | $1,735 |
| 2022 | $6,795 | $2,035 | $300 | $1,735 |
| 2021 | $6,795 | $2,035 | $300 | $1,735 |
| 2020 | $7,100 | $2,035 | $300 | $1,735 |
| 2019 | $7,100 | $0 | $0 | $0 |
| 2018 | $6,601 | $2,035 | $300 | $1,735 |
| 2017 | $6,601 | $2,035 | $300 | $1,735 |
| 2016 | $6,576 | $2,035 | $300 | $1,735 |
| 2015 | -- | $2,035 | $300 | $1,735 |
| 2014 | -- | $2,035 | $300 | $1,735 |
Source: Public Records
Map
Nearby Homes