4 Ridge View Ct Smithfield, RI 02917
Estimated Value: $541,000 - $643,000
3
Beds
3
Baths
1,876
Sq Ft
$318/Sq Ft
Est. Value
About This Home
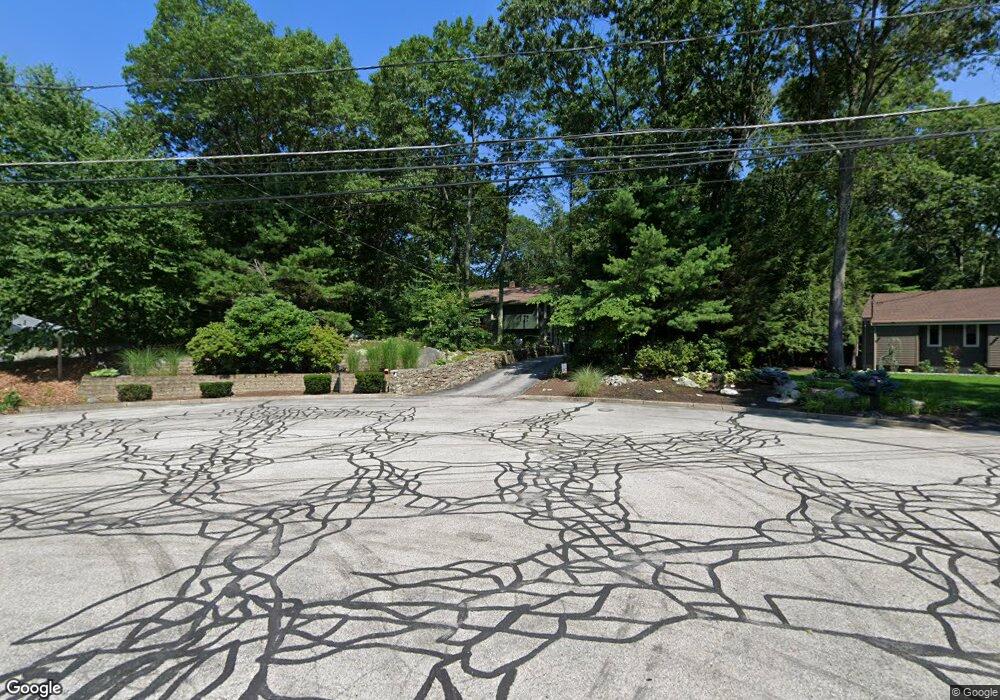
This home is located at 4 Ridge View Ct, Smithfield, RI 02917 and is currently estimated at $596,269, approximately $317 per square foot. 4 Ridge View Ct is a home located in Providence County with nearby schools including Raymond Laperche School, Vincent J. Gallagher Middle School, and Smithfield High School.
Ownership History
Date
Name
Owned For
Owner Type
Purchase Details
Closed on
Jun 12, 2003
Sold by
Castro Hector and Castro Icela
Bought by
Caprio David and Ledoux Maureen
Current Estimated Value
Purchase Details
Closed on
Dec 12, 2001
Sold by
Roy John E and Roy Bonne Sue
Bought by
Castro Hector J and Castro Icela
Purchase Details
Closed on
Oct 31, 1996
Sold by
Cimini Harold P and Cummings Esther L
Bought by
Roy John E and Bedard Bonnie Sue
Create a Home Valuation Report for This Property
The Home Valuation Report is an in-depth analysis detailing your home's value as well as a comparison with similar homes in the area
Home Values in the Area
Average Home Value in this Area
Purchase History
| Date | Buyer | Sale Price | Title Company |
|---|---|---|---|
| Caprio David | $290,000 | -- | |
| Caprio David | $290,000 | -- | |
| Castro Hector J | $256,000 | -- | |
| Castro Hector J | $256,000 | -- | |
| Roy John E | $152,000 | -- | |
| Roy John E | $152,000 | -- |
Source: Public Records
Mortgage History
| Date | Status | Borrower | Loan Amount |
|---|---|---|---|
| Open | Roy John E | $246,700 | |
| Closed | Roy John E | $277,800 |
Source: Public Records
Tax History Compared to Growth
Tax History
| Year | Tax Paid | Tax Assessment Tax Assessment Total Assessment is a certain percentage of the fair market value that is determined by local assessors to be the total taxable value of land and additions on the property. | Land | Improvement |
|---|---|---|---|---|
| 2025 | $6,119 | $493,900 | $186,800 | $307,100 |
| 2024 | $6,120 | $423,800 | $158,200 | $265,600 |
| 2023 | $5,815 | $423,800 | $158,200 | $265,600 |
| 2022 | $5,662 | $423,800 | $158,200 | $265,600 |
| 2021 | $5,542 | $323,500 | $140,100 | $183,400 |
| 2020 | $5,438 | $323,500 | $140,100 | $183,400 |
| 2019 | $5,438 | $323,500 | $140,100 | $183,400 |
| 2018 | $5,372 | $305,900 | $140,100 | $165,800 |
| 2017 | $5,372 | $305,900 | $140,100 | $165,800 |
| 2016 | $5,118 | $305,900 | $140,100 | $165,800 |
| 2015 | $4,818 | $274,200 | $118,100 | $156,100 |
| 2012 | $4,471 | $279,100 | $137,700 | $141,400 |
Source: Public Records
Map
Nearby Homes
- 48 Pheasant Run Unit A
- 12 Wadsworth Ave
- 6 Wadsworth Ave
- 310 Twin River Rd
- 323 Angell Rd
- 25 Linfield Cir
- 302 Waterman Ave
- 15 Woodland Ave
- 2 Julia Dr
- 5 Meadow Ct
- 209 Waterman Ave
- 24 Whipple Rd
- 1765 Bicentennial Way Unit B
- 52 Bicentennial Way
- 4 Lake Dr
- 9 E Lakeview Dr
- 58 Alfred Ave
- 13 Ivy Place
- 27 Dean Ave
- 626 Smithfield Rd Unit 903