Estimated Value: $1,216,331 - $1,509,000
4
Beds
4
Baths
3,484
Sq Ft
$389/Sq Ft
Est. Value
About This Home
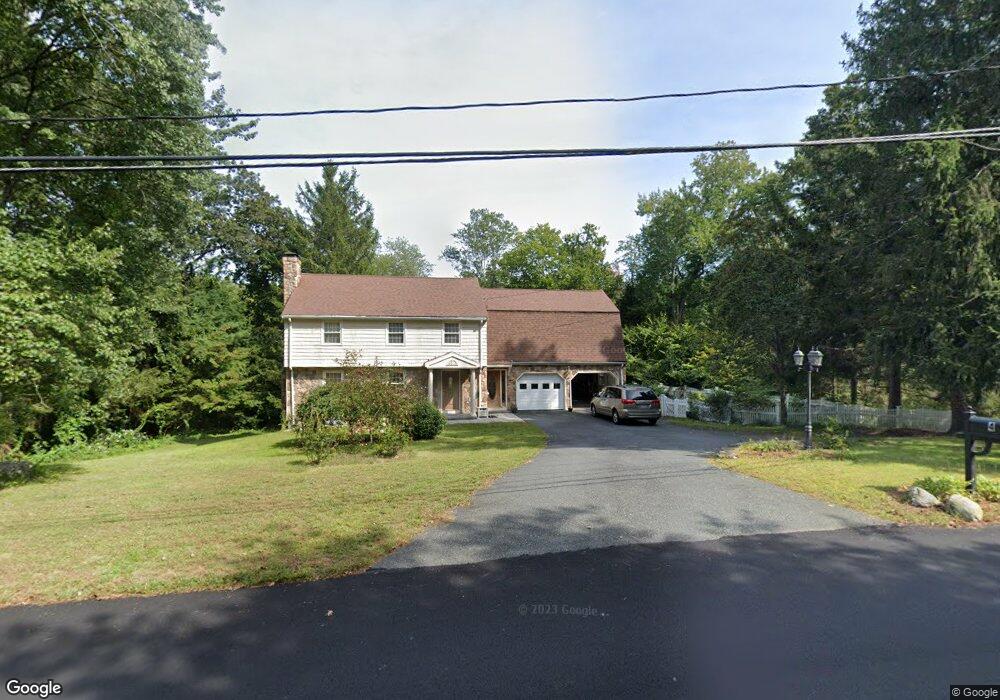
This home is located at 4 Riga Rd, Dover, MA 02030 and is currently estimated at $1,356,583, approximately $389 per square foot. 4 Riga Rd is a home located in Norfolk County with nearby schools including Chickering Elementary School, Dover-Sherborn Regional Middle School, and Dover-Sherborn Regional High School.
Ownership History
Date
Name
Owned For
Owner Type
Purchase Details
Closed on
May 25, 2010
Sold by
Sopchockchai Bundit
Bought by
Sopchockchai Bundit and Sopchockchai Maria L
Current Estimated Value
Home Financials for this Owner
Home Financials are based on the most recent Mortgage that was taken out on this home.
Original Mortgage
$402,000
Outstanding Balance
$271,809
Interest Rate
5.23%
Mortgage Type
Purchase Money Mortgage
Estimated Equity
$1,084,774
Purchase Details
Closed on
May 12, 1999
Sold by
Spencer Haven H
Bought by
Sopchockchai Bundit
Home Financials for this Owner
Home Financials are based on the most recent Mortgage that was taken out on this home.
Original Mortgage
$160,000
Interest Rate
6.92%
Mortgage Type
Purchase Money Mortgage
Create a Home Valuation Report for This Property
The Home Valuation Report is an in-depth analysis detailing your home's value as well as a comparison with similar homes in the area
Home Values in the Area
Average Home Value in this Area
Purchase History
| Date | Buyer | Sale Price | Title Company |
|---|---|---|---|
| Sopchockchai Bundit | -- | -- | |
| Sopchockchai Bundit | $450,000 | -- |
Source: Public Records
Mortgage History
| Date | Status | Borrower | Loan Amount |
|---|---|---|---|
| Open | Sopchockchai Bundit | $1 | |
| Open | Sopchockchai Bundit | $402,000 | |
| Previous Owner | Sopchockchai Bundit | $240,000 | |
| Previous Owner | Sopchockchai Bundit | $322,700 | |
| Previous Owner | Sopchockchai Bundit | $160,000 |
Source: Public Records
Tax History
| Year | Tax Paid | Tax Assessment Tax Assessment Total Assessment is a certain percentage of the fair market value that is determined by local assessors to be the total taxable value of land and additions on the property. | Land | Improvement |
|---|---|---|---|---|
| 2025 | $11,511 | $1,021,400 | $580,500 | $440,900 |
| 2024 | $10,670 | $973,500 | $560,900 | $412,600 |
| 2023 | $10,329 | $847,300 | $492,100 | $355,200 |
| 2022 | $9,751 | $785,100 | $472,400 | $312,700 |
| 2021 | $9,974 | $773,800 | $472,400 | $301,400 |
| 2020 | $9,936 | $773,800 | $472,400 | $301,400 |
| 2019 | $10,005 | $773,800 | $472,400 | $301,400 |
| 2018 | $9,725 | $757,400 | $472,400 | $285,000 |
| 2017 | $9,485 | $726,800 | $433,200 | $293,600 |
| 2016 | $9,361 | $726,800 | $433,200 | $293,600 |
| 2015 | $8,957 | $705,300 | $411,700 | $293,600 |
Source: Public Records
Map
Nearby Homes
Your Personal Tour Guide
Ask me questions while you tour the home.