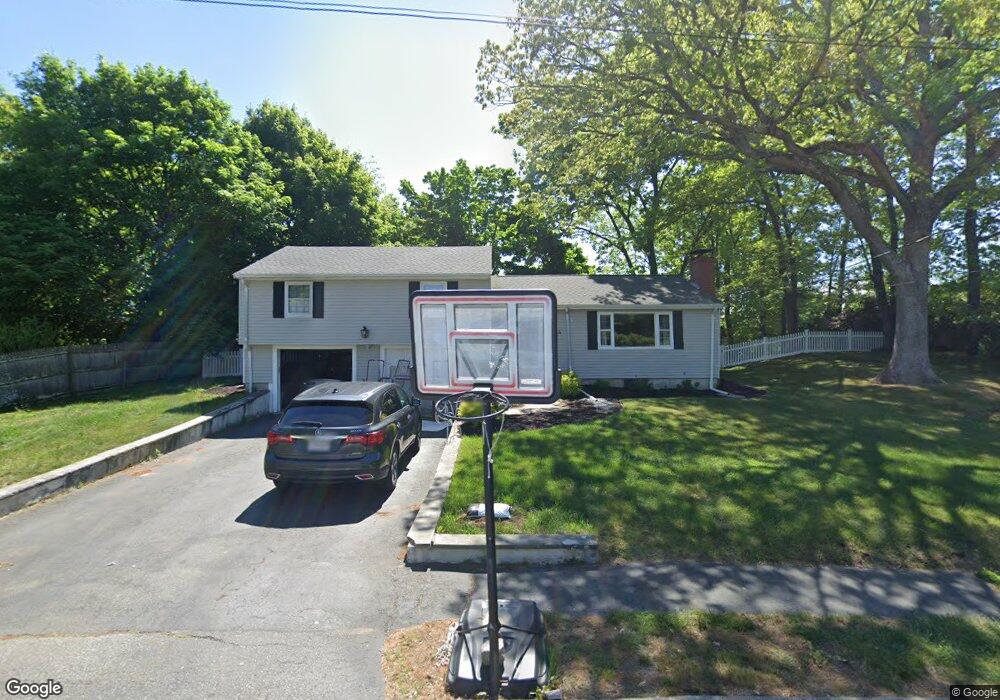
4 Roundy Rd Lynnfield, MA 01940
Estimated Value: $887,000 - $995,000
3
Beds
2
Baths
2,185
Sq Ft
$433/Sq Ft
Est. Value
About This Home
This home is located at 4 Roundy Rd, Lynnfield, MA 01940 and is currently estimated at $946,602, approximately $433 per square foot. 4 Roundy Rd is a home located in Essex County with nearby schools including Lynnfield Middle School, Lynnfield High School, and Our Lady Of Assumption School.
Ownership History
Date
Name
Owned For
Owner Type
Purchase Details
Closed on
Jun 16, 2014
Sold by
Katz Ellen H
Bought by
Alves Gregory P
Current Estimated Value
Home Financials for this Owner
Home Financials are based on the most recent Mortgage that was taken out on this home.
Original Mortgage
$400,000
Outstanding Balance
$305,048
Interest Rate
4.27%
Mortgage Type
New Conventional
Estimated Equity
$641,554
Create a Home Valuation Report for This Property
The Home Valuation Report is an in-depth analysis detailing your home's value as well as a comparison with similar homes in the area
Home Values in the Area
Average Home Value in this Area
Purchase History
| Date | Buyer | Sale Price | Title Company |
|---|---|---|---|
| Alves Gregory P | $500,000 | -- |
Source: Public Records
Mortgage History
| Date | Status | Borrower | Loan Amount |
|---|---|---|---|
| Open | Alves Gregory P | $400,000 |
Source: Public Records
Tax History
| Year | Tax Paid | Tax Assessment Tax Assessment Total Assessment is a certain percentage of the fair market value that is determined by local assessors to be the total taxable value of land and additions on the property. | Land | Improvement |
|---|---|---|---|---|
| 2025 | $8,830 | $836,200 | $564,200 | $272,000 |
| 2024 | $8,450 | $804,000 | $542,500 | $261,500 |
| 2023 | $8,490 | $751,300 | $514,500 | $236,800 |
| 2022 | $8,201 | $684,000 | $472,500 | $211,500 |
| 2021 | $7,707 | $580,800 | $385,000 | $195,800 |
| 2020 | $7,525 | $540,600 | $344,800 | $195,800 |
| 2019 | $7,520 | $540,600 | $344,800 | $195,800 |
| 2018 | $7,439 | $540,600 | $344,800 | $195,800 |
| 2017 | $7,280 | $528,300 | $332,500 | $195,800 |
| 2016 | $6,740 | $464,800 | $285,300 | $179,500 |
| 2015 | $6,719 | $463,700 | $284,200 | $179,500 |
Source: Public Records
Map
Nearby Homes
- 33 Rockwood Rd
- 11 Elizabeth Way
- 527 Salem St Unit 42
- 410 Salem St Unit 1203
- 35 Lincoln Ave
- 344 Broadway
- 741 Salem St
- 143 Winona St
- 9 Broadway Unit 210
- 11 Hutchins Cir
- 903 Foxwood Cir Unit 903
- 114 Lake St
- 6 Ashley Ct
- 103 Foxwood Cir
- 67 Woodcrest Dr
- 395 Vernon St
- 37 Locust St
- 20 Pine Hill Rd
- 12 Heritage Ln
- 7 Pinewood Rd
Your Personal Tour Guide
Ask me questions while you tour the home.