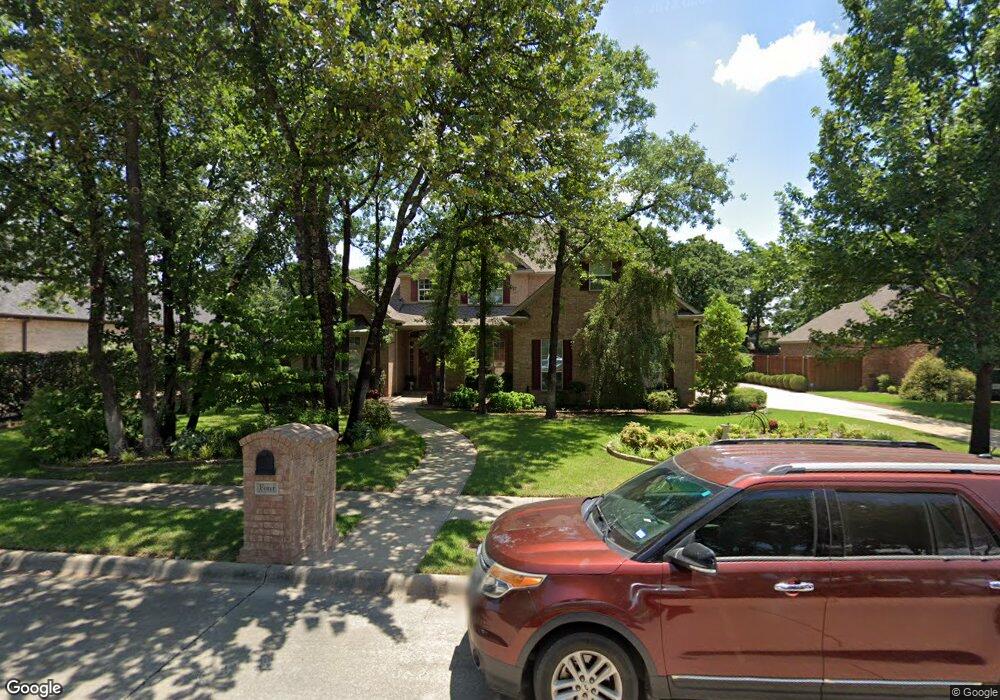
4 Royal Oaks Cir Denton, TX 76210
South Denton NeighborhoodEstimated Value: $699,405 - $746,000
3
Beds
4
Baths
3,342
Sq Ft
$217/Sq Ft
Est. Value
About This Home
This home is located at 4 Royal Oaks Cir, Denton, TX 76210 and is currently estimated at $724,351, approximately $216 per square foot. 4 Royal Oaks Cir is a home located in Denton County with nearby schools including Ryan Elementary School, McMath Middle School, and Denton High School.
Ownership History
Date
Name
Owned For
Owner Type
Purchase Details
Closed on
Jun 28, 2023
Sold by
Roberts Larry Ray and Roberts Beverly Ann
Bought by
Roberts Larry R & Beverly Ann Revocable Trust and Roberts
Current Estimated Value
Purchase Details
Closed on
Oct 18, 2002
Sold by
Corley Richard Q and Corley Betty G
Bought by
Roberts Larry and Roberts Beverly
Purchase Details
Closed on
Mar 6, 2002
Sold by
Cogan Karen D and Petrie Trent A
Bought by
Corley Richard and Corley Betty G
Purchase Details
Closed on
Sep 29, 1998
Sold by
Giles Charles and Giles Phyllis
Bought by
Cogan Karen D and Petrie Trent A
Purchase Details
Closed on
Aug 22, 1997
Sold by
Tekell Terry and Tekell Gayla
Bought by
Giles Charles and Giles Phyllis
Home Financials for this Owner
Home Financials are based on the most recent Mortgage that was taken out on this home.
Original Mortgage
$45,122
Interest Rate
7.47%
Create a Home Valuation Report for This Property
The Home Valuation Report is an in-depth analysis detailing your home's value as well as a comparison with similar homes in the area
Home Values in the Area
Average Home Value in this Area
Purchase History
| Date | Buyer | Sale Price | Title Company |
|---|---|---|---|
| Roberts Larry R & Beverly Ann Revocable Trust | -- | None Listed On Document | |
| Roberts Larry | -- | -- | |
| Roberts Larry | -- | -- | |
| Corley Richard | -- | -- | |
| Corley Richard | -- | -- | |
| Cogan Karen D | -- | -- | |
| Cogan Karen D | -- | -- | |
| Giles Charles | -- | -- |
Source: Public Records
Mortgage History
| Date | Status | Borrower | Loan Amount |
|---|---|---|---|
| Previous Owner | Giles Charles | $45,122 |
Source: Public Records
Tax History Compared to Growth
Tax History
| Year | Tax Paid | Tax Assessment Tax Assessment Total Assessment is a certain percentage of the fair market value that is determined by local assessors to be the total taxable value of land and additions on the property. | Land | Improvement |
|---|---|---|---|---|
| 2025 | $4,113 | $680,782 | $172,904 | $556,918 |
| 2024 | $11,946 | $618,893 | $0 | $0 |
| 2023 | $4,123 | $562,630 | $197,604 | $595,244 |
| 2022 | $10,858 | $511,482 | $123,503 | $419,376 |
| 2021 | $10,337 | $480,178 | $98,802 | $381,376 |
| 2020 | $9,662 | $422,713 | $98,802 | $323,911 |
| 2019 | $10,148 | $425,286 | $98,802 | $326,484 |
| 2018 | $10,097 | $418,000 | $98,802 | $322,402 |
| 2017 | $9,393 | $380,000 | $98,802 | $281,198 |
| 2016 | $6,578 | $355,000 | $65,868 | $289,132 |
| 2015 | $6,300 | $335,000 | $65,868 | $269,132 |
| 2014 | $6,300 | $306,000 | $57,635 | $248,365 |
| 2013 | -- | $306,000 | $57,635 | $248,365 |
Source: Public Records
Map
Nearby Homes
- 9 Royal Oaks Cir
- 3916 Maggies Meadow
- 21 Wellington Oaks Cir
- 33 Oak Forrest Cir
- 9 Oak Forrest Cir
- 4100 Willow Grove Ave
- 100 Bentwood Ct
- 4200 Thistle Hill
- Type - 2 Plan at Ryan Woods
- 900 Mallard Ave
- 813 Turtle Creek Ave
- 3601 Montecito Dr
- 4212 Stonetrail Dr
- 3805 Granada Trail
- 3612 Granada Trail
- 5508 Thistle Hill
- 917 Fallbrook Ave
- 409 Meadowlands Dr
- 1008 Turtle Creek Ave
- 316 Oakbluff Dr
- 6 Royal Oaks Cir
- 2 Royal Oaks Cir
- 37 Royal Oaks Cir
- 35 Royal Oaks Cir
- 39 Royal Oaks Cir
- 8 Royal Oaks Cir
- 5 Royal Oaks Cir
- 3 Royal Oaks Cir
- 7 Royal Oaks Cir
- 33 Royal Oaks Cir
- 1 Royal Oaks Cir
- 204 Royal Oaks Place
- 10 Royal Oaks Cir
- 201 Royal Oaks Ct
- 31 Royal Oaks Cir
- 36 Royal Oaks Cir
- 42 Wellington Oaks Cir
- 40 Wellington Oaks Cir
- 38 Royal Oaks Cir
- 203 Royal Oaks Place