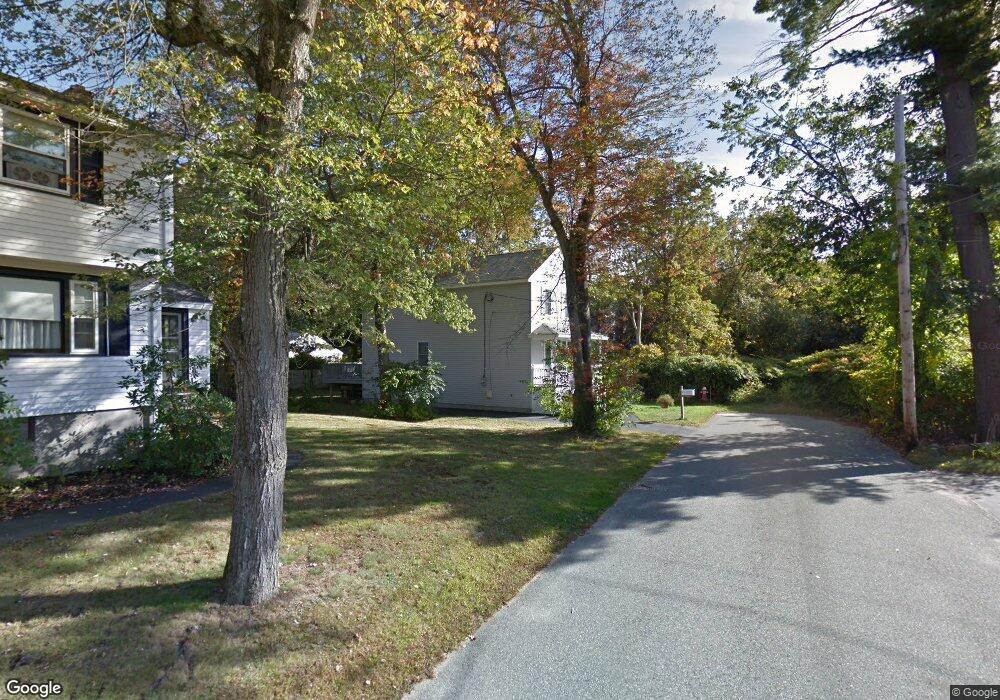
4 Saint Paul St Wilmington, MA 01887
Estimated Value: $653,430 - $816,000
3
Beds
2
Baths
1,440
Sq Ft
$525/Sq Ft
Est. Value
About This Home
This home is located at 4 Saint Paul St, Wilmington, MA 01887 and is currently estimated at $756,108, approximately $525 per square foot. 4 Saint Paul St is a home located in Middlesex County with nearby schools including Wilmington Middle School, Wilmington High School, and Abundant Life Christian School and Childcare.
Ownership History
Date
Name
Owned For
Owner Type
Purchase Details
Closed on
Jan 24, 2002
Sold by
Jessica Rt
Bought by
Mackay Gary
Current Estimated Value
Home Financials for this Owner
Home Financials are based on the most recent Mortgage that was taken out on this home.
Original Mortgage
$130,000
Outstanding Balance
$53,829
Interest Rate
7.08%
Estimated Equity
$702,279
Purchase Details
Closed on
Sep 20, 2000
Sold by
Gina-Christa Rt
Bought by
Jessica Rt
Home Financials for this Owner
Home Financials are based on the most recent Mortgage that was taken out on this home.
Original Mortgage
$116,000
Interest Rate
8%
Mortgage Type
Purchase Money Mortgage
Purchase Details
Closed on
Aug 19, 1993
Sold by
Tighe James D
Bought by
Gina-Christa Rt
Home Financials for this Owner
Home Financials are based on the most recent Mortgage that was taken out on this home.
Original Mortgage
$30,000
Interest Rate
7.11%
Mortgage Type
Purchase Money Mortgage
Purchase Details
Closed on
Jun 12, 1991
Sold by
Campbell Campbell John K John K
Bought by
Citicorp Mtg Inc
Purchase Details
Closed on
Oct 3, 1988
Sold by
Steuart Jeffrey C
Bought by
Campbell John K
Home Financials for this Owner
Home Financials are based on the most recent Mortgage that was taken out on this home.
Original Mortgage
$103,500
Interest Rate
10.66%
Mortgage Type
Purchase Money Mortgage
Create a Home Valuation Report for This Property
The Home Valuation Report is an in-depth analysis detailing your home's value as well as a comparison with similar homes in the area
Home Values in the Area
Average Home Value in this Area
Purchase History
| Date | Buyer | Sale Price | Title Company |
|---|---|---|---|
| Mackay Gary | $30,000 | -- | |
| Jessica Rt | $52,000 | -- | |
| Gina-Christa Rt | $50,000 | -- | |
| Tighe James D | $15,000 | -- | |
| Citicorp Mtg Inc | $81,900 | -- | |
| Campbell John K | $120,000 | -- |
Source: Public Records
Mortgage History
| Date | Status | Borrower | Loan Amount |
|---|---|---|---|
| Open | Campbell John K | $130,000 | |
| Previous Owner | Campbell John K | $116,000 | |
| Previous Owner | Campbell John K | $30,000 | |
| Previous Owner | Campbell John K | $103,500 |
Source: Public Records
Tax History Compared to Growth
Tax History
| Year | Tax Paid | Tax Assessment Tax Assessment Total Assessment is a certain percentage of the fair market value that is determined by local assessors to be the total taxable value of land and additions on the property. | Land | Improvement |
|---|---|---|---|---|
| 2025 | $6,560 | $572,900 | $243,300 | $329,600 |
| 2024 | $6,434 | $562,900 | $243,300 | $319,600 |
| 2023 | $6,013 | $503,600 | $221,200 | $282,400 |
| 2022 | $5,693 | $436,900 | $184,300 | $252,600 |
| 2021 | $5,600 | $404,600 | $167,600 | $237,000 |
| 2020 | $5,287 | $389,300 | $167,600 | $221,700 |
| 2019 | $5,086 | $369,900 | $159,600 | $210,300 |
| 2018 | $4,940 | $342,800 | $152,000 | $190,800 |
| 2017 | $4,819 | $333,500 | $144,700 | $188,800 |
| 2016 | $4,537 | $310,100 | $137,800 | $172,300 |
| 2015 | $4,402 | $306,300 | $137,800 | $168,500 |
| 2014 | $4,130 | $290,000 | $131,300 | $158,700 |
Source: Public Records
Map
Nearby Homes