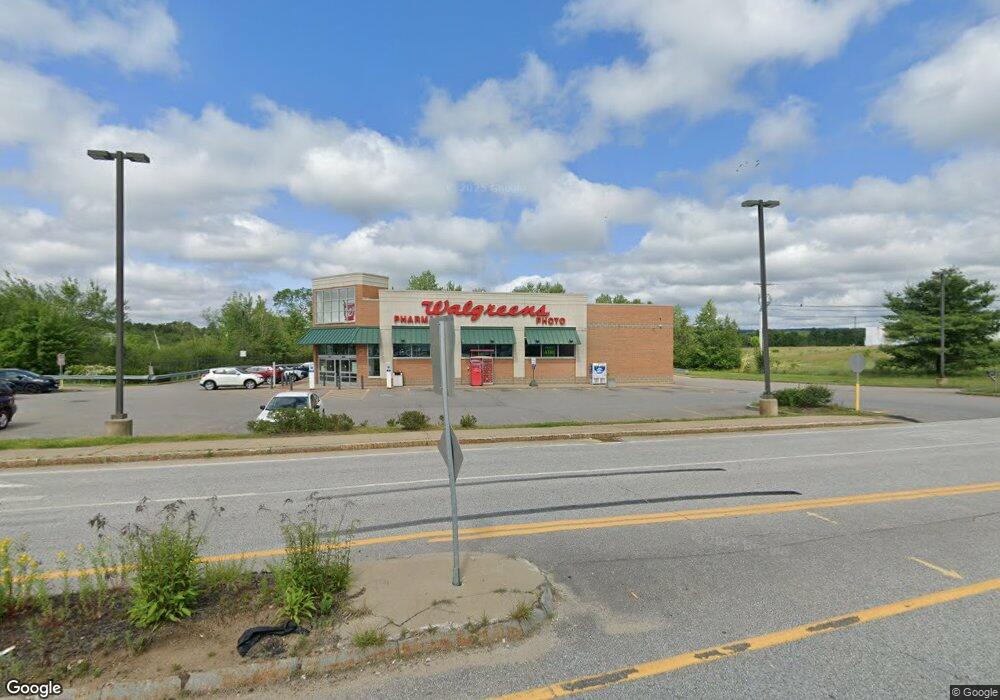
4 Sanborn Rd Tilton, NH 03276
Tilton NeighborhoodEstimated Value: $16,356,288
--
Bed
2
Baths
14,645
Sq Ft
$1,117/Sq Ft
Est. Value
About This Home
This home is located at 4 Sanborn Rd, Tilton, NH 03276 and is currently estimated at $16,356,288, approximately $1,116 per square foot. 4 Sanborn Rd is a home located in Belknap County with nearby schools including Sanbornton Central School, Winnisquam Regional Middle School, and Winnisquam Regional High School.
Ownership History
Date
Name
Owned For
Owner Type
Purchase Details
Closed on
Oct 7, 2008
Sold by
Walker Tilton Llc
Bought by
Arc Wgtltnh001 Llc
Current Estimated Value
Home Financials for this Owner
Home Financials are based on the most recent Mortgage that was taken out on this home.
Original Mortgage
$6,755,000
Outstanding Balance
$4,515,578
Interest Rate
6.54%
Mortgage Type
Commercial
Estimated Equity
$11,840,710
Purchase Details
Closed on
May 2, 2005
Sold by
Oliver-Rhudick Joanna
Bought by
Cornerstone Realty
Home Financials for this Owner
Home Financials are based on the most recent Mortgage that was taken out on this home.
Original Mortgage
$550,000
Interest Rate
5.95%
Mortgage Type
Commercial
Create a Home Valuation Report for This Property
The Home Valuation Report is an in-depth analysis detailing your home's value as well as a comparison with similar homes in the area
Home Values in the Area
Average Home Value in this Area
Purchase History
| Date | Buyer | Sale Price | Title Company |
|---|---|---|---|
| Arc Wgtltnh001 Llc | $7,960,000 | -- | |
| Cornerstone Realty | $1,600,000 | -- |
Source: Public Records
Mortgage History
| Date | Status | Borrower | Loan Amount |
|---|---|---|---|
| Open | Cornerstone Realty | $6,755,000 | |
| Previous Owner | Cornerstone Realty | $550,000 |
Source: Public Records
Tax History Compared to Growth
Tax History
| Year | Tax Paid | Tax Assessment Tax Assessment Total Assessment is a certain percentage of the fair market value that is determined by local assessors to be the total taxable value of land and additions on the property. | Land | Improvement |
|---|---|---|---|---|
| 2024 | $41,706 | $3,861,700 | $1,630,400 | $2,231,300 |
| 2023 | $44,279 | $2,500,200 | $1,760,800 | $739,400 |
| 2022 | $40,175 | $2,500,000 | $1,760,800 | $739,200 |
| 2021 | $52,638 | $3,217,500 | $1,760,800 | $1,456,700 |
| 2020 | $59,427 | $3,217,500 | $1,760,800 | $1,456,700 |
| 2019 | $14 | $3,217,500 | $1,760,800 | $1,456,700 |
| 2018 | $63,412 | $2,721,100 | $1,354,100 | $1,367,000 |
| 2017 | $58,504 | $2,721,100 | $1,354,100 | $1,367,000 |
| 2016 | $28 | $2,638,200 | $1,354,100 | $1,284,100 |
| 2015 | $60,599 | $2,638,200 | $1,354,100 | $1,284,100 |
| 2014 | $52,527 | $2,638,200 | $1,354,100 | $1,284,100 |
| 2013 | $52,539 | $2,871,000 | $1,549,200 | $1,321,800 |
| 2012 | $52,396 | $2,871,000 | $1,549,200 | $1,321,800 |
Source: Public Records
Map
Nearby Homes
- 41 Willow St
- 24 Morrison Ave
- 124 E Main St
- 32 Andrews Rd
- 14 Emerald Ln
- 44 Noyes Rd
- 30 Crystal Ln
- 52 Noyes Rd
- 35 Bittersweet Ln
- 164 Gardners Grove Rd
- 4 West St
- 20 Patricia Ann Dr
- 9 High St
- 282 Bay Hill Rd
- 7 Simmons Ct
- 44 Fellows Hill Rd
- 59 Coons Point Rd
- 22 Cedar St
- 0 Ashuelot Dr Unit 47
- 25 Highland Ave