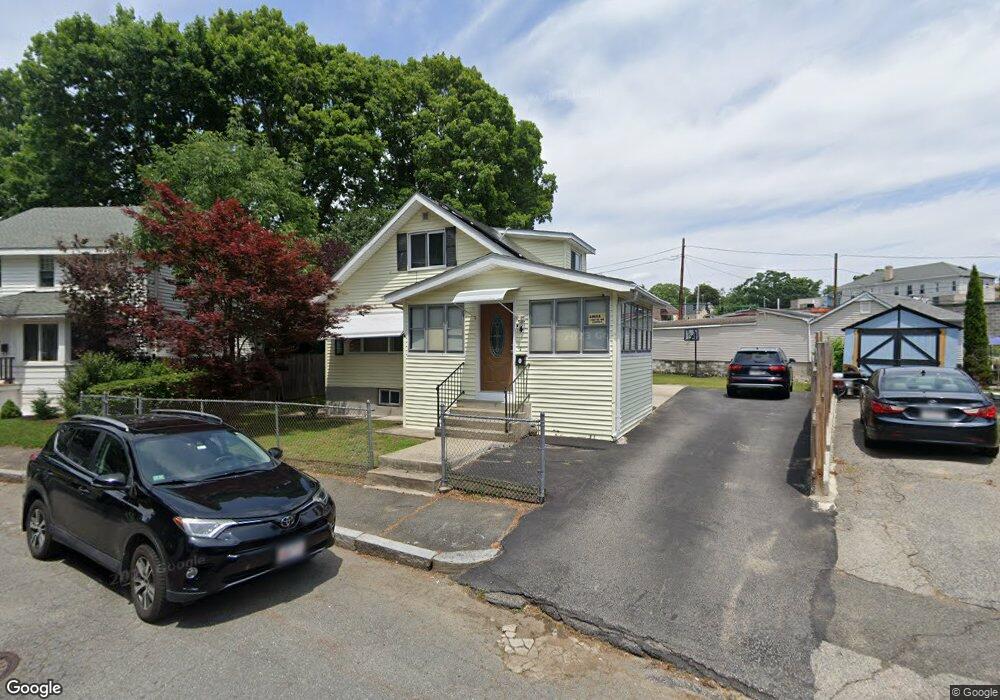
4 September St Worcester, MA 01602
Columbus Park NeighborhoodEstimated Value: $412,000 - $472,000
4
Beds
1
Bath
1,098
Sq Ft
$403/Sq Ft
Est. Value
About This Home
This home is located at 4 September St, Worcester, MA 01602 and is currently estimated at $442,306, approximately $402 per square foot. 4 September St is a home located in Worcester County with nearby schools including Chandler Magnet, Jacob Hiatt Magnet School, and May Street Elementary School.
Ownership History
Date
Name
Owned For
Owner Type
Purchase Details
Closed on
Jun 5, 2008
Sold by
Wells Fargo Bk
Bought by
Qato Adelina and Cuni Adriatik
Current Estimated Value
Home Financials for this Owner
Home Financials are based on the most recent Mortgage that was taken out on this home.
Original Mortgage
$78,750
Outstanding Balance
$50,688
Interest Rate
6.11%
Mortgage Type
Purchase Money Mortgage
Estimated Equity
$391,618
Purchase Details
Closed on
Feb 27, 2008
Sold by
Kender Julie
Bought by
Us Bk
Purchase Details
Closed on
May 1, 2006
Sold by
Est Ritchotte Louise T and Glidden Robin S
Bought by
Kender Julie
Home Financials for this Owner
Home Financials are based on the most recent Mortgage that was taken out on this home.
Original Mortgage
$164,000
Interest Rate
6.4%
Mortgage Type
Purchase Money Mortgage
Create a Home Valuation Report for This Property
The Home Valuation Report is an in-depth analysis detailing your home's value as well as a comparison with similar homes in the area
Home Values in the Area
Average Home Value in this Area
Purchase History
| Date | Buyer | Sale Price | Title Company |
|---|---|---|---|
| Qato Adelina | $105,000 | -- | |
| Us Bk | $173,000 | -- | |
| Kender Julie | $205,000 | -- |
Source: Public Records
Mortgage History
| Date | Status | Borrower | Loan Amount |
|---|---|---|---|
| Open | Qato Adelina | $78,750 | |
| Previous Owner | Kender Julie | $164,000 |
Source: Public Records
Tax History
| Year | Tax Paid | Tax Assessment Tax Assessment Total Assessment is a certain percentage of the fair market value that is determined by local assessors to be the total taxable value of land and additions on the property. | Land | Improvement |
|---|---|---|---|---|
| 2025 | $4,891 | $370,800 | $109,300 | $261,500 |
| 2024 | $4,771 | $347,000 | $109,300 | $237,700 |
| 2023 | $4,590 | $320,100 | $95,000 | $225,100 |
| 2022 | $4,196 | $275,900 | $76,000 | $199,900 |
| 2021 | $2,339 | $251,700 | $60,800 | $190,900 |
| 2020 | $2,239 | $235,100 | $60,800 | $174,300 |
| 2019 | $3,766 | $209,200 | $54,700 | $154,500 |
| 2018 | $1,960 | $197,600 | $54,700 | $142,900 |
| 2017 | $3,602 | $187,400 | $54,700 | $132,700 |
| 2016 | $3,621 | $175,700 | $41,200 | $134,500 |
| 2015 | $3,526 | $175,700 | $41,200 | $134,500 |
| 2014 | $3,433 | $175,700 | $41,200 | $134,500 |
Source: Public Records
Map
Nearby Homes
- 33 Carlisle St
- 24 Hadwen Rd
- 60 June St
- 15 Longfellow Rd
- 108 Longfellow Rd
- 16 Sherwood Rd
- 18 Hadwen Ln
- 32 Zenith Dr
- 34 Rosslare Dr Unit 108
- 6 Ludington Rd
- 12 Westfield St
- 114 Lovell St
- 6 Newton Ave
- 345 Park Ave
- 3A Chalmers Rd
- 3 Suburban Rd
- 19 Highland Terrace
- 212 Dewey St
- 19 Kenilworth Rd
- 78 Downing St
Your Personal Tour Guide
Ask me questions while you tour the home.