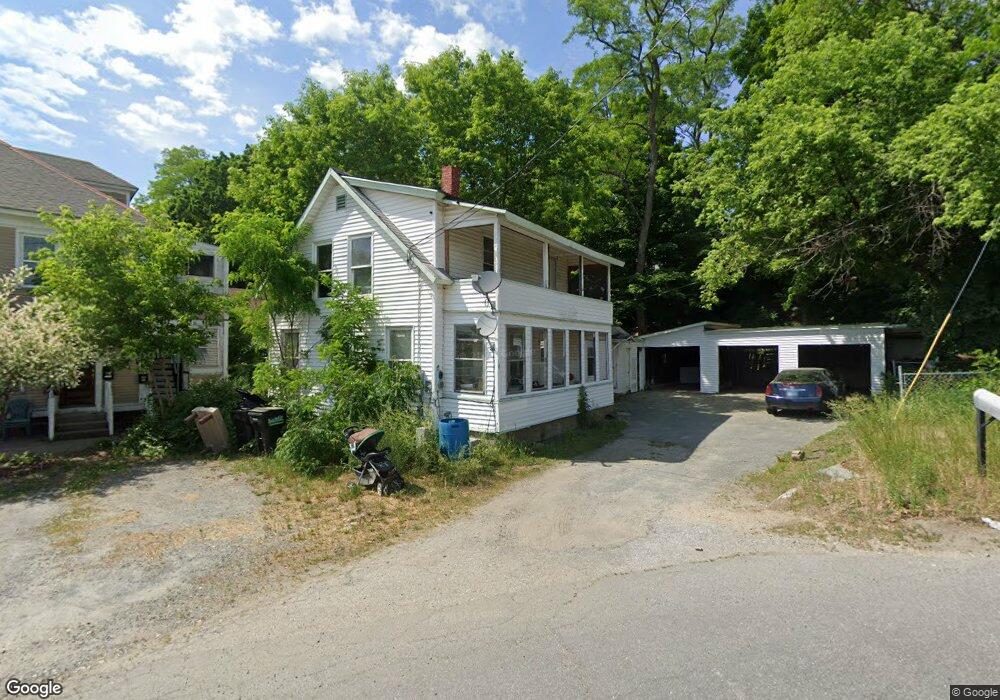
4 Spring St Claremont, NH 03743
West Side NeighborhoodEstimated Value: $184,000 - $246,000
3
Beds
2
Baths
1,143
Sq Ft
$187/Sq Ft
Est. Value
About This Home
This home is located at 4 Spring St, Claremont, NH 03743 and is currently estimated at $214,120, approximately $187 per square foot. 4 Spring St is a home located in Sullivan County with nearby schools including Disnard Elementary School, Claremont Middle School, and Stevens High School.
Ownership History
Date
Name
Owned For
Owner Type
Purchase Details
Closed on
Jan 29, 2009
Sold by
Wells Fargo Bank Na Tr
Bought by
Villa Services Llc
Current Estimated Value
Purchase Details
Closed on
Jul 30, 2008
Sold by
Rawling William
Bought by
Wells Fargo Bank Na
Purchase Details
Closed on
Nov 16, 2004
Sold by
Kbm Ventures Llc
Bought by
Rawling William and Rawling Juanita
Home Financials for this Owner
Home Financials are based on the most recent Mortgage that was taken out on this home.
Original Mortgage
$73,950
Interest Rate
5.75%
Mortgage Type
Purchase Money Mortgage
Purchase Details
Closed on
Apr 19, 2004
Sold by
Mckinney Donald C
Bought by
Kbm Ventures Llc
Purchase Details
Closed on
Jun 1, 1999
Sold by
Desilets Gilberte
Bought by
Mckinney Donald C
Home Financials for this Owner
Home Financials are based on the most recent Mortgage that was taken out on this home.
Original Mortgage
$57,800
Interest Rate
6.82%
Create a Home Valuation Report for This Property
The Home Valuation Report is an in-depth analysis detailing your home's value as well as a comparison with similar homes in the area
Home Values in the Area
Average Home Value in this Area
Purchase History
| Date | Buyer | Sale Price | Title Company |
|---|---|---|---|
| Villa Services Llc | $14,100 | -- | |
| Wells Fargo Bank Na | $84,900 | -- | |
| Rawling William | $87,000 | -- | |
| Kbm Ventures Llc | $46,700 | -- | |
| Mckinney Donald C | $57,800 | -- |
Source: Public Records
Mortgage History
| Date | Status | Borrower | Loan Amount |
|---|---|---|---|
| Previous Owner | Mckinney Donald C | $73,950 | |
| Previous Owner | Mckinney Donald C | $57,800 |
Source: Public Records
Tax History Compared to Growth
Tax History
| Year | Tax Paid | Tax Assessment Tax Assessment Total Assessment is a certain percentage of the fair market value that is determined by local assessors to be the total taxable value of land and additions on the property. | Land | Improvement |
|---|---|---|---|---|
| 2024 | $4,629 | $158,200 | $27,700 | $130,500 |
| 2023 | $4,398 | $158,200 | $27,700 | $130,500 |
| 2022 | $3,309 | $79,400 | $13,200 | $66,200 |
| 2021 | $3,254 | $79,400 | $13,200 | $66,200 |
| 2020 | $3,233 | $79,400 | $13,200 | $66,200 |
| 2019 | $3,205 | $79,600 | $13,200 | $66,400 |
| 2018 | $2,849 | $67,700 | $13,200 | $54,500 |
| 2017 | $2,888 | $67,700 | $13,200 | $54,500 |
| 2016 | $3,039 | $71,300 | $13,200 | $58,100 |
| 2015 | $2,957 | $71,300 | $13,200 | $58,100 |
| 2014 | $2,947 | $71,300 | $13,200 | $58,100 |
| 2013 | $3,578 | $98,700 | $13,100 | $85,600 |
Source: Public Records
Map
Nearby Homes