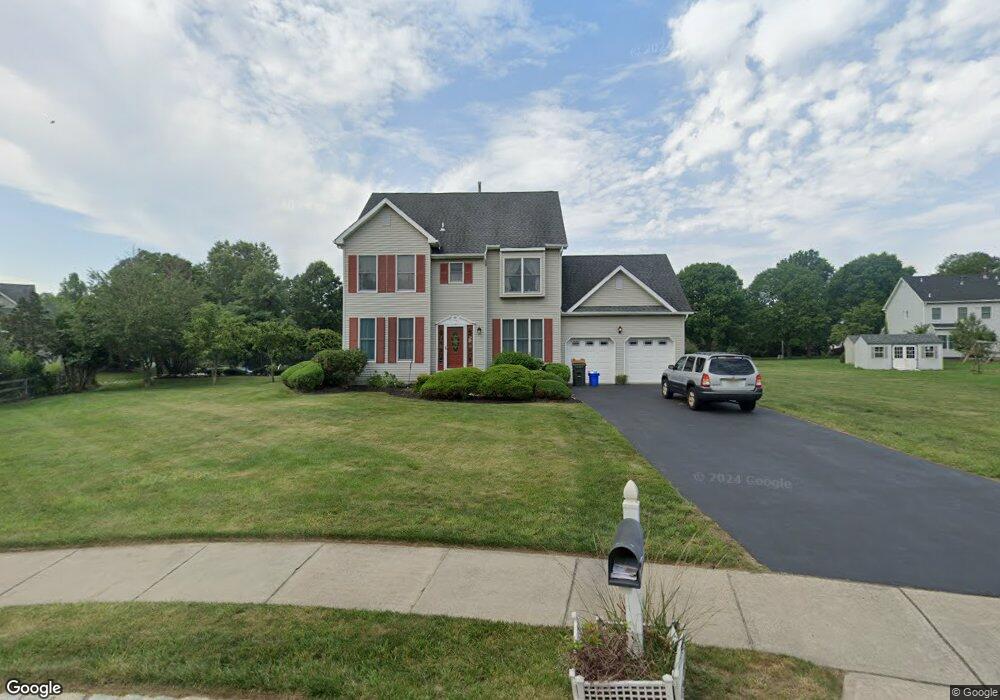
4 Stanton Ct Plainsboro, NJ 08536
Estimated Value: $875,601 - $975,000
--
Bed
--
Bath
2,058
Sq Ft
$443/Sq Ft
Est. Value
About This Home
This home is located at 4 Stanton Ct, Plainsboro, NJ 08536 and is currently estimated at $912,400, approximately $443 per square foot. 4 Stanton Ct is a home located in Middlesex County with nearby schools including John V.B. Wicoff Elementary School, Millstone River School, and Community Middle School.
Ownership History
Date
Name
Owned For
Owner Type
Purchase Details
Closed on
Jul 1, 1999
Sold by
Witchre Jeffrey
Bought by
Mukherjee Atanu and Mukherjee Mahua
Current Estimated Value
Home Financials for this Owner
Home Financials are based on the most recent Mortgage that was taken out on this home.
Original Mortgage
$262,800
Interest Rate
8.1%
Purchase Details
Closed on
Nov 22, 1996
Sold by
Glacken David
Bought by
Witcher Jeffrey
Home Financials for this Owner
Home Financials are based on the most recent Mortgage that was taken out on this home.
Original Mortgage
$205,000
Interest Rate
7.36%
Create a Home Valuation Report for This Property
The Home Valuation Report is an in-depth analysis detailing your home's value as well as a comparison with similar homes in the area
Home Values in the Area
Average Home Value in this Area
Purchase History
| Date | Buyer | Sale Price | Title Company |
|---|---|---|---|
| Mukherjee Atanu | $292,000 | -- | |
| Witcher Jeffrey | $259,900 | -- |
Source: Public Records
Mortgage History
| Date | Status | Borrower | Loan Amount |
|---|---|---|---|
| Previous Owner | Mukherjee Atanu | $262,800 | |
| Previous Owner | Witcher Jeffrey | $205,000 |
Source: Public Records
Tax History Compared to Growth
Tax History
| Year | Tax Paid | Tax Assessment Tax Assessment Total Assessment is a certain percentage of the fair market value that is determined by local assessors to be the total taxable value of land and additions on the property. | Land | Improvement |
|---|---|---|---|---|
| 2025 | $15,482 | $592,500 | $206,000 | $386,500 |
| 2024 | $15,109 | $592,500 | $206,000 | $386,500 |
| 2023 | $15,109 | $592,500 | $206,000 | $386,500 |
| 2022 | $14,878 | $592,500 | $206,000 | $386,500 |
| 2021 | $13,859 | $592,500 | $206,000 | $386,500 |
| 2020 | $14,173 | $592,500 | $206,000 | $386,500 |
| 2019 | $13,859 | $592,500 | $206,000 | $386,500 |
| 2018 | $13,550 | $592,500 | $206,000 | $386,500 |
| 2017 | $13,165 | $592,500 | $206,000 | $386,500 |
| 2016 | $12,585 | $592,500 | $206,000 | $386,500 |
| 2015 | $13,779 | $545,900 | $205,000 | $340,900 |
| 2014 | $13,642 | $545,900 | $205,000 | $340,900 |
Source: Public Records
Map
Nearby Homes