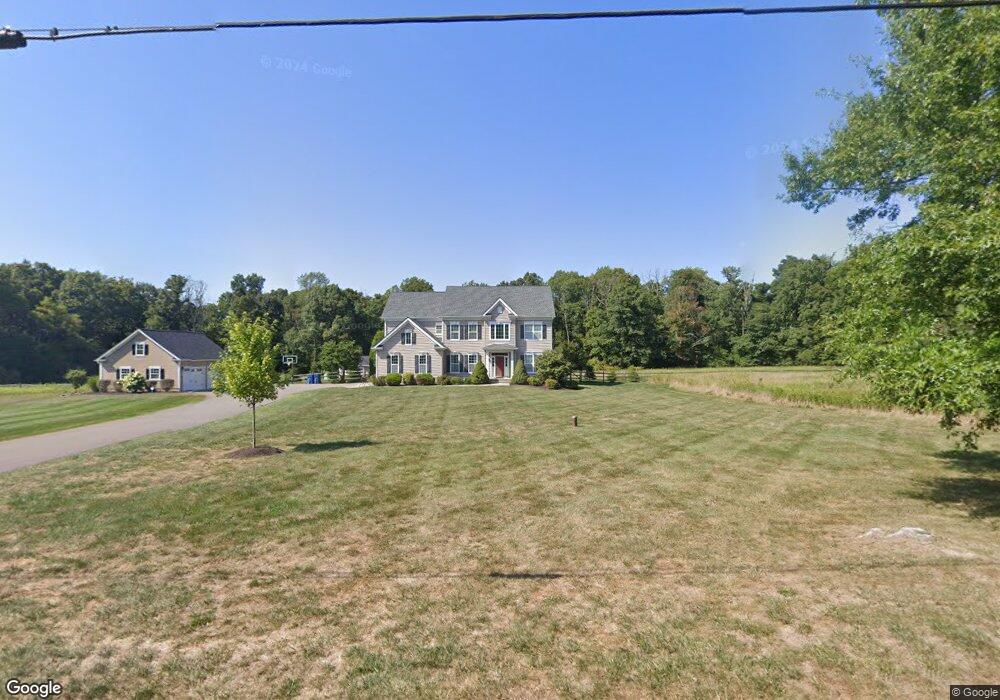
4 Stone Signpost Rd Flemington, NJ 08822
Estimated Value: $881,951 - $1,118,000
4
Beds
3
Baths
3,058
Sq Ft
$322/Sq Ft
Est. Value
About This Home
This home is located at 4 Stone Signpost Rd, Flemington, NJ 08822 and is currently estimated at $985,488, approximately $322 per square foot. 4 Stone Signpost Rd is a home located in Hunterdon County with nearby schools including Delaware Township School and Hunterdon Central Regional High School District.
Ownership History
Date
Name
Owned For
Owner Type
Purchase Details
Closed on
Aug 26, 2014
Sold by
Dunay Brian and Dunay Awilda
Bought by
Creter Matthew and Krautwald Laurie
Current Estimated Value
Home Financials for this Owner
Home Financials are based on the most recent Mortgage that was taken out on this home.
Original Mortgage
$472,000
Outstanding Balance
$361,347
Interest Rate
4.14%
Mortgage Type
New Conventional
Estimated Equity
$624,141
Purchase Details
Closed on
Aug 26, 2010
Sold by
Previ John L
Bought by
Dunay Brian and Dunay Awilda
Home Financials for this Owner
Home Financials are based on the most recent Mortgage that was taken out on this home.
Original Mortgage
$280,000
Interest Rate
4.51%
Mortgage Type
New Conventional
Purchase Details
Closed on
Dec 13, 2005
Sold by
Previ Helen
Bought by
Previ Helen
Create a Home Valuation Report for This Property
The Home Valuation Report is an in-depth analysis detailing your home's value as well as a comparison with similar homes in the area
Home Values in the Area
Average Home Value in this Area
Purchase History
| Date | Buyer | Sale Price | Title Company |
|---|---|---|---|
| Creter Matthew | $590,000 | Multiple | |
| Dunay Brian | $580,000 | First American Title Ins Co | |
| Previ John L | $154,000 | First American Title Ins Co | |
| Previ Helen | -- | None Available |
Source: Public Records
Mortgage History
| Date | Status | Borrower | Loan Amount |
|---|---|---|---|
| Open | Creter Matthew | $472,000 | |
| Previous Owner | Dunay Brian | $280,000 |
Source: Public Records
Tax History
| Year | Tax Paid | Tax Assessment Tax Assessment Total Assessment is a certain percentage of the fair market value that is determined by local assessors to be the total taxable value of land and additions on the property. | Land | Improvement |
|---|---|---|---|---|
| 2025 | $16,788 | $610,700 | $201,500 | $409,200 |
| 2024 | $15,508 | $610,700 | $201,500 | $409,200 |
| 2023 | $15,508 | $579,100 | $201,500 | $377,600 |
| 2022 | $14,964 | $579,100 | $201,500 | $377,600 |
| 2021 | $14,645 | $579,100 | $201,500 | $377,600 |
| 2020 | $14,958 | $579,100 | $201,500 | $377,600 |
| 2019 | $14,350 | $567,400 | $201,500 | $365,900 |
| 2018 | $14,469 | $567,400 | $201,500 | $365,900 |
| 2017 | $13,859 | $552,600 | $201,500 | $351,100 |
| 2016 | $13,749 | $552,600 | $201,500 | $351,100 |
| 2015 | $13,926 | $552,600 | $201,500 | $351,100 |
| 2014 | $13,611 | $552,600 | $201,500 | $351,100 |
Source: Public Records
Map
Nearby Homes
- 22 Biser Rd
- 168 Locktown Flemington Rd
- 615 County Road 579
- 911 County Road 579
- 25 Fawn Dr
- 221 Old Croton Rd
- 17 Village Glen Rd
- 168 Locktown Sergeantsville Rd
- 550 Barbertown Point Breeze Rd
- 181 Old Croton Rd
- 180 Locktown Sergeantsville Rd
- 1 Bonetown Rd
- 3 Manchur Ct
- 526 County Road 579
- 19 Donna Dr
- 128 Old Croton Rd
- 40 Sergeantsville Rd
- 57 Featherbed Ln
- 107 Oak Grove Rd
- 40 Dayton Rd
- 6 Stone Signpost Rd
- 2 Stone Signpost Rd
- 759 County Route 579
- 759 County Road 579
- 783 County Route 579
- 783 County Road 579
- 15 Stone Signpost Rd
- 818 Croton Rd
- 800 County Road 579
- 800 County Road 579
- 811 County Road 579
- 814 County Road 579
- 812 County Road 579
- 810 County Road 579
- 818 County Road 579
- 818 County Road 579
- 820 County Road 579
- 820 County Road 579
- 817 County Road 579
- 20 Stone Signpost Rd
Your Personal Tour Guide
Ask me questions while you tour the home.