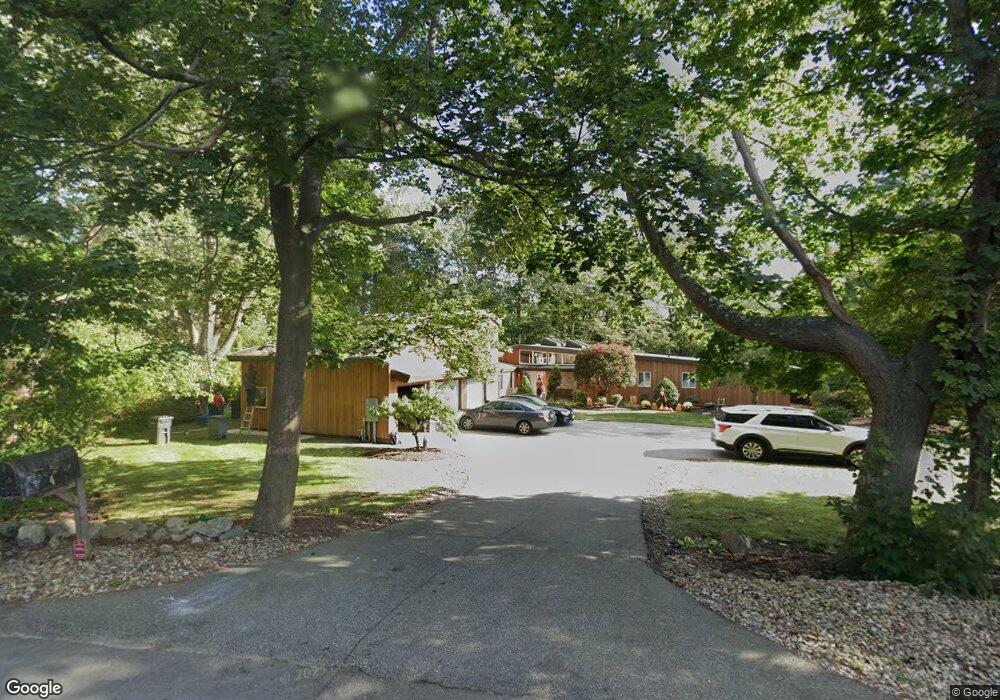
4 Sunset Rock Rd Andover, MA 01810
Southern Andover NeighborhoodEstimated Value: $1,190,000 - $1,653,000
4
Beds
3
Baths
4,344
Sq Ft
$328/Sq Ft
Est. Value
About This Home
This home is located at 4 Sunset Rock Rd, Andover, MA 01810 and is currently estimated at $1,426,823, approximately $328 per square foot. 4 Sunset Rock Rd is a home located in Essex County with nearby schools including South Elementary School, Doherty Middle School, and Andover High School.
Ownership History
Date
Name
Owned For
Owner Type
Purchase Details
Closed on
Dec 30, 2021
Sold by
Giangrande David and Giangrande Karen
Bought by
4 Sunset Rock Road Rt
Current Estimated Value
Purchase Details
Closed on
Aug 9, 1995
Sold by
Giangrande David
Bought by
Rullo James A
Purchase Details
Closed on
Mar 1, 1995
Sold by
Obrien Frederic S
Bought by
Giangrande David
Create a Home Valuation Report for This Property
The Home Valuation Report is an in-depth analysis detailing your home's value as well as a comparison with similar homes in the area
Home Values in the Area
Average Home Value in this Area
Purchase History
| Date | Buyer | Sale Price | Title Company |
|---|---|---|---|
| 4 Sunset Rock Road Rt | -- | None Available | |
| Rullo James A | $175,000 | -- | |
| Giangrande David | $390,000 | -- |
Source: Public Records
Mortgage History
| Date | Status | Borrower | Loan Amount |
|---|---|---|---|
| Previous Owner | Giangrande David | $350,000 | |
| Previous Owner | Giangrande David | $350,000 |
Source: Public Records
Tax History Compared to Growth
Tax History
| Year | Tax Paid | Tax Assessment Tax Assessment Total Assessment is a certain percentage of the fair market value that is determined by local assessors to be the total taxable value of land and additions on the property. | Land | Improvement |
|---|---|---|---|---|
| 2024 | $16,649 | $1,292,600 | $675,800 | $616,800 |
| 2023 | $15,913 | $1,164,900 | $609,100 | $555,800 |
| 2022 | $14,955 | $1,024,300 | $530,300 | $494,000 |
| 2021 | $14,305 | $935,600 | $482,400 | $453,200 |
| 2020 | $13,716 | $913,800 | $470,600 | $443,200 |
| 2019 | $15,020 | $983,600 | $552,000 | $431,600 |
| 2018 | $14,505 | $927,400 | $531,100 | $396,300 |
| 2017 | $13,049 | $859,600 | $520,700 | $338,900 |
| 2016 | $12,741 | $859,700 | $520,700 | $339,000 |
| 2015 | $12,277 | $820,100 | $500,600 | $319,500 |
Source: Public Records
Map
Nearby Homes