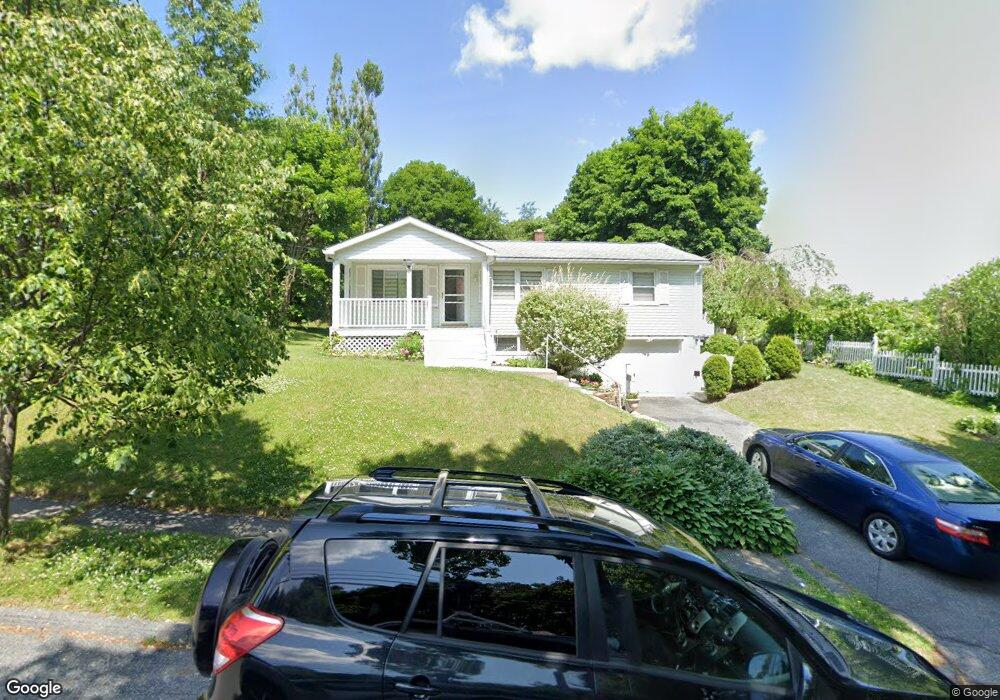
4 Sussex Ln Worcester, MA 01602
West Tatnuck NeighborhoodEstimated Value: $410,000 - $443,000
3
Beds
1
Bath
1,317
Sq Ft
$325/Sq Ft
Est. Value
About This Home
This home is located at 4 Sussex Ln, Worcester, MA 01602 and is currently estimated at $428,512, approximately $325 per square foot. 4 Sussex Ln is a home located in Worcester County with nearby schools including West Tatnuck School, Chandler Magnet, and Jacob Hiatt Magnet School.
Ownership History
Date
Name
Owned For
Owner Type
Purchase Details
Closed on
Aug 24, 2004
Sold by
Leary John K and Leary Katrina L
Bought by
Prifti Arjan
Current Estimated Value
Home Financials for this Owner
Home Financials are based on the most recent Mortgage that was taken out on this home.
Original Mortgage
$130,000
Outstanding Balance
$64,594
Interest Rate
6.03%
Mortgage Type
Purchase Money Mortgage
Estimated Equity
$363,918
Purchase Details
Closed on
Aug 13, 1998
Sold by
Boltruczyk Peter A
Bought by
Leary John K and Leary Robert E
Home Financials for this Owner
Home Financials are based on the most recent Mortgage that was taken out on this home.
Original Mortgage
$107,771
Interest Rate
6.94%
Mortgage Type
Purchase Money Mortgage
Purchase Details
Closed on
Jul 19, 1990
Sold by
Balcunas John L
Bought by
Boltruczyk Peter A
Create a Home Valuation Report for This Property
The Home Valuation Report is an in-depth analysis detailing your home's value as well as a comparison with similar homes in the area
Home Values in the Area
Average Home Value in this Area
Purchase History
| Date | Buyer | Sale Price | Title Company |
|---|---|---|---|
| Prifti Arjan | $230,000 | -- | |
| Leary John K | $108,000 | -- | |
| Boltruczyk Peter A | $107,000 | -- |
Source: Public Records
Mortgage History
| Date | Status | Borrower | Loan Amount |
|---|---|---|---|
| Open | Prifti Arjan | $130,000 | |
| Previous Owner | Boltruczyk Peter A | $137,025 | |
| Previous Owner | Boltruczyk Peter A | $15,000 | |
| Previous Owner | Boltruczyk Peter A | $107,771 | |
| Previous Owner | Boltruczyk Peter A | $80,500 |
Source: Public Records
Tax History Compared to Growth
Tax History
| Year | Tax Paid | Tax Assessment Tax Assessment Total Assessment is a certain percentage of the fair market value that is determined by local assessors to be the total taxable value of land and additions on the property. | Land | Improvement |
|---|---|---|---|---|
| 2025 | $4,632 | $351,200 | $118,000 | $233,200 |
| 2024 | $4,540 | $330,200 | $118,000 | $212,200 |
| 2023 | $4,381 | $305,500 | $102,600 | $202,900 |
| 2022 | $3,874 | $254,700 | $82,100 | $172,600 |
| 2021 | $3,722 | $228,600 | $65,700 | $162,900 |
| 2020 | $3,580 | $210,600 | $65,700 | $144,900 |
| 2019 | $3,362 | $186,800 | $59,100 | $127,700 |
| 2018 | $3,264 | $172,600 | $59,100 | $113,500 |
| 2017 | $3,289 | $171,100 | $59,100 | $112,000 |
| 2016 | $3,182 | $154,400 | $43,100 | $111,300 |
| 2015 | $3,099 | $154,400 | $43,100 | $111,300 |
| 2014 | $3,017 | $154,400 | $43,100 | $111,300 |
Source: Public Records
Map
Nearby Homes