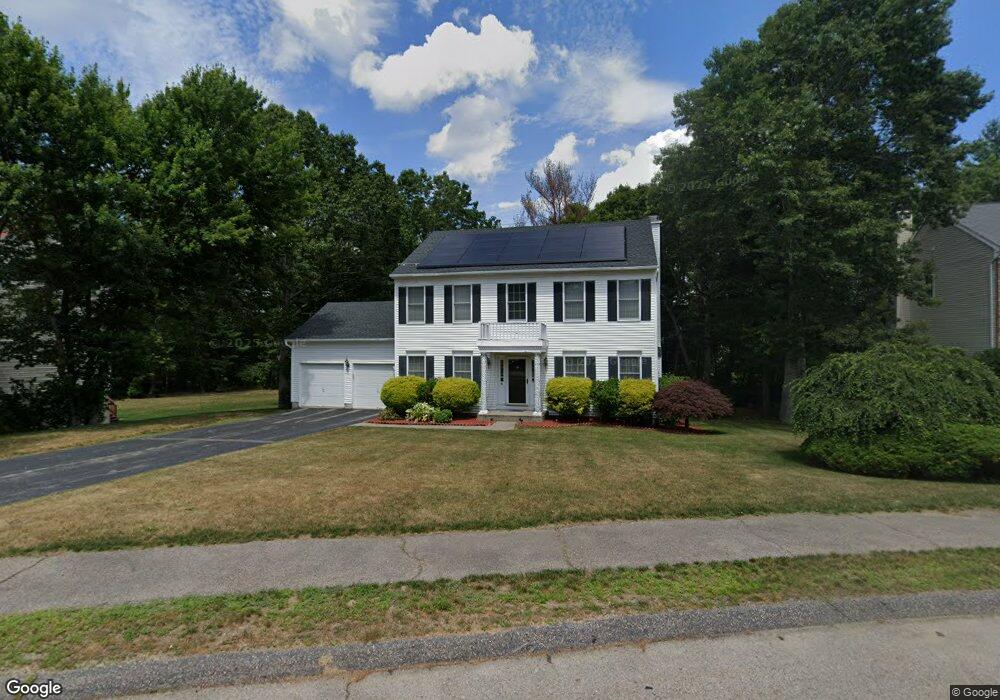
4 Triphammer Rd Sharon, MA 02067
Estimated Value: $1,065,635 - $1,258,000
4
Beds
3
Baths
2,340
Sq Ft
$484/Sq Ft
Est. Value
About This Home
This home is located at 4 Triphammer Rd, Sharon, MA 02067 and is currently estimated at $1,133,659, approximately $484 per square foot. 4 Triphammer Rd is a home located in Norfolk County with nearby schools including Heights Elementary School, Sharon Middle School, and Sharon High School.
Ownership History
Date
Name
Owned For
Owner Type
Purchase Details
Closed on
Sep 30, 2002
Sold by
Tess John and Tess Christina M
Bought by
Mukthineni Ravi
Current Estimated Value
Home Financials for this Owner
Home Financials are based on the most recent Mortgage that was taken out on this home.
Original Mortgage
$423,900
Interest Rate
6.25%
Mortgage Type
Purchase Money Mortgage
Purchase Details
Closed on
Jun 21, 1996
Sold by
Mass Limited Land Corp
Bought by
Sullivan Christina
Create a Home Valuation Report for This Property
The Home Valuation Report is an in-depth analysis detailing your home's value as well as a comparison with similar homes in the area
Home Values in the Area
Average Home Value in this Area
Purchase History
We collect this data history from publicly available records. To have your information removed, we recommend requesting removal directly through your county’s website.
| Date | Buyer | Sale Price | Title Company |
|---|---|---|---|
| Mukthineni Ravi | $529,900 | -- | |
| Mukthineni Ravi | $529,900 | -- | |
| Sullivan Christina | $268,817 | -- | |
| Sullivan Christina M | $268,817 | -- |
Source: Public Records
Mortgage History
We collect this data history from publicly available records. To have your information removed, we recommend requesting removal directly through your county’s website.
| Date | Status | Borrower | Loan Amount |
|---|---|---|---|
| Open | Sullivan Christina M | $295,000 | |
| Closed | Mukthineni Ravi | $423,900 |
Source: Public Records
Tax History
| Year | Tax Paid | Tax Assessment Tax Assessment Total Assessment is a certain percentage of the fair market value that is determined by local assessors to be the total taxable value of land and additions on the property. | Land | Improvement |
|---|---|---|---|---|
| 2025 | $16,293 | $932,100 | $490,800 | $441,300 |
| 2024 | $15,609 | $887,900 | $450,300 | $437,600 |
| 2023 | $14,786 | $795,400 | $414,200 | $381,200 |
| 2022 | $14,005 | $709,100 | $345,200 | $363,900 |
| 2021 | $13,876 | $679,200 | $325,700 | $353,500 |
| 2020 | $12,905 | $679,200 | $325,700 | $353,500 |
| 2019 | $12,912 | $665,200 | $311,700 | $353,500 |
| 2018 | $12,765 | $659,000 | $305,500 | $353,500 |
| 2017 | $12,537 | $639,000 | $285,500 | $353,500 |
| 2016 | $12,223 | $607,800 | $285,500 | $322,300 |
| 2015 | $11,922 | $587,300 | $277,500 | $309,800 |
| 2014 | $11,039 | $537,200 | $252,400 | $284,800 |
Source: Public Records
Map
Nearby Homes
- 9 Grover Ln
- Lot One Old Wolomolopoag St
- Lot Two Old Wolomolopoag St
- 31 Atherton Rd
- 6 Osprey Rd
- 8 Weyman Ln
- 15 Wadsworth Way
- 68 Alden St
- 15 Boyden Dr
- 214 Mechanic St
- 52 Morse St
- 13 Brookside Dr
- 1 Tamworth Rd
- 147 Chestnut St Unit A
- 147 Chestnut St Unit B
- 178 Morse St
- 8 Windsor Dr
- 167 Morse St
- 10 Roberta Rd
- 12 Elm St
Your Personal Tour Guide
Ask me questions while you tour the home.