Estimated Value: $1,313,556 - $1,563,000
2
Beds
2
Baths
1,510
Sq Ft
$924/Sq Ft
Est. Value
About This Home
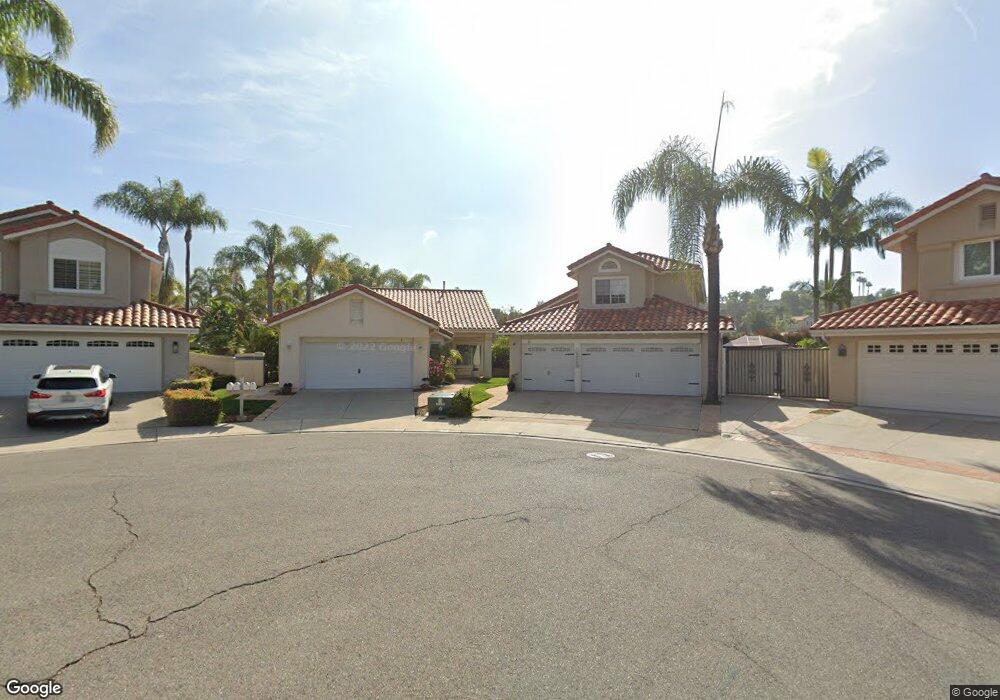
This home is located at 4 Turano, Laguna Niguel, CA 92677 and is currently estimated at $1,395,389, approximately $924 per square foot. 4 Turano is a home located in Orange County with nearby schools including Hidden Hills Elementary, Niguel Hills Middle School, and Dana Hills High School.
Ownership History
Date
Name
Owned For
Owner Type
Purchase Details
Closed on
Feb 15, 2024
Sold by
Hurst Dianne W
Bought by
Hurst Family Trust and Hurst
Current Estimated Value
Purchase Details
Closed on
Jul 15, 2009
Sold by
Hurst Charles V and Hurst Dianne W
Bought by
Hurst Charles Vernon and Hurst Dianne W
Purchase Details
Closed on
Dec 9, 1993
Sold by
Lee Karl D and Porter Greg D
Bought by
Hurst Charles and Hurst Dianne W
Home Financials for this Owner
Home Financials are based on the most recent Mortgage that was taken out on this home.
Original Mortgage
$220,950
Interest Rate
4.5%
Create a Home Valuation Report for This Property
The Home Valuation Report is an in-depth analysis detailing your home's value as well as a comparison with similar homes in the area
Home Values in the Area
Average Home Value in this Area
Purchase History
| Date | Buyer | Sale Price | Title Company |
|---|---|---|---|
| Hurst Family Trust | -- | None Listed On Document | |
| Hurst Charles Vernon | -- | None Available | |
| Hurst Charles | $245,500 | Chicago Title Insurance Co |
Source: Public Records
Mortgage History
| Date | Status | Borrower | Loan Amount |
|---|---|---|---|
| Previous Owner | Hurst Charles | $220,950 |
Source: Public Records
Tax History Compared to Growth
Tax History
| Year | Tax Paid | Tax Assessment Tax Assessment Total Assessment is a certain percentage of the fair market value that is determined by local assessors to be the total taxable value of land and additions on the property. | Land | Improvement |
|---|---|---|---|---|
| 2025 | $4,088 | $417,261 | $198,063 | $219,198 |
| 2024 | $4,088 | $409,080 | $194,180 | $214,900 |
| 2023 | $4,000 | $401,059 | $190,372 | $210,687 |
| 2022 | $3,922 | $393,196 | $186,640 | $206,556 |
| 2021 | $3,845 | $385,487 | $182,981 | $202,506 |
| 2020 | $3,806 | $381,535 | $181,105 | $200,430 |
| 2019 | $3,730 | $374,054 | $177,554 | $196,500 |
| 2018 | $3,658 | $366,720 | $174,072 | $192,648 |
| 2017 | $3,585 | $359,530 | $170,659 | $188,871 |
| 2016 | $3,515 | $352,481 | $167,313 | $185,168 |
| 2015 | $3,461 | $347,187 | $164,800 | $182,387 |
| 2014 | $3,393 | $340,387 | $161,572 | $178,815 |
Source: Public Records
Map
Nearby Homes