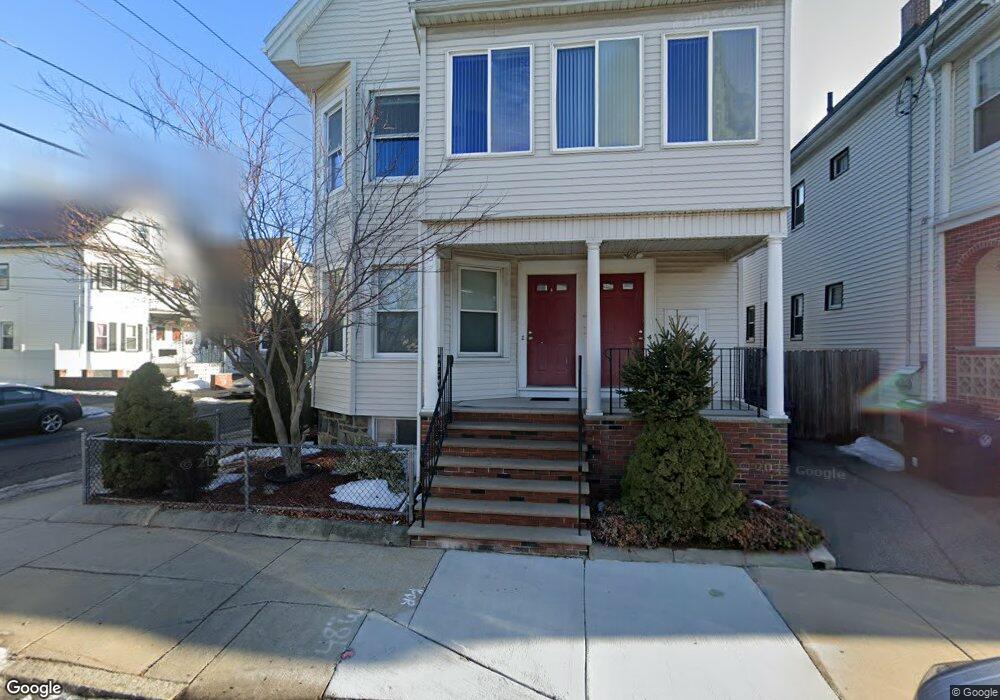
4 Upland Rd Everett, MA 02149
Glendale NeighborhoodEstimated Value: $861,636 - $1,046,000
5
Beds
3
Baths
2,828
Sq Ft
$338/Sq Ft
Est. Value
About This Home
This home is located at 4 Upland Rd, Everett, MA 02149 and is currently estimated at $956,409, approximately $338 per square foot. 4 Upland Rd is a home located in Middlesex County with nearby schools including Everett High School and Pioneer Charter School of Science.
Ownership History
Date
Name
Owned For
Owner Type
Purchase Details
Closed on
Jul 30, 1999
Sold by
Healey Edward J and Healey Sheila A
Bought by
Causevic Enver
Current Estimated Value
Home Financials for this Owner
Home Financials are based on the most recent Mortgage that was taken out on this home.
Original Mortgage
$192,000
Interest Rate
7.61%
Mortgage Type
Purchase Money Mortgage
Create a Home Valuation Report for This Property
The Home Valuation Report is an in-depth analysis detailing your home's value as well as a comparison with similar homes in the area
Home Values in the Area
Average Home Value in this Area
Purchase History
| Date | Buyer | Sale Price | Title Company |
|---|---|---|---|
| Causevic Enver | $240,000 | -- |
Source: Public Records
Mortgage History
| Date | Status | Borrower | Loan Amount |
|---|---|---|---|
| Open | Causevic Enver | $310,000 | |
| Closed | Causevic Enver | $192,000 |
Source: Public Records
Tax History
| Year | Tax Paid | Tax Assessment Tax Assessment Total Assessment is a certain percentage of the fair market value that is determined by local assessors to be the total taxable value of land and additions on the property. | Land | Improvement |
|---|---|---|---|---|
| 2025 | $10,560 | $927,100 | $252,500 | $674,600 |
| 2024 | $9,726 | $848,700 | $224,500 | $624,200 |
| 2023 | $9,486 | $805,300 | $205,800 | $599,500 |
| 2022 | $7,787 | $751,600 | $196,400 | $555,200 |
| 2021 | $7,045 | $713,800 | $175,800 | $538,000 |
| 2020 | $7,202 | $676,900 | $175,800 | $501,100 |
| 2019 | $7,589 | $613,000 | $167,400 | $445,600 |
| 2018 | $7,201 | $522,600 | $145,900 | $376,700 |
| 2017 | $6,676 | $462,300 | $112,200 | $350,100 |
| 2016 | $6,166 | $426,700 | $112,200 | $314,500 |
| 2015 | $5,872 | $401,900 | $105,500 | $296,400 |
Source: Public Records
Map
Nearby Homes
- 15 Staples Ave Unit 45
- 15 Staples Ave Unit 31
- 21 Staples Ave Unit 26
- 21 Central Ave Unit 10
- 44 Walnut St
- 48 Cleveland Ave
- 210 Hancock St
- 132 Vernal St
- 139 Bucknam St
- 20 Fairmount St
- 68 Linden St Unit 49
- 21 Hillside Ave Unit 21
- 13 Coolidge St
- 340 Main St
- 37 Argyle St
- 19 Mills St
- 53 Sycamore St
- 24 Corey St Unit 101
- 110 Ferry St
- 56 Valley St
Your Personal Tour Guide
Ask me questions while you tour the home.