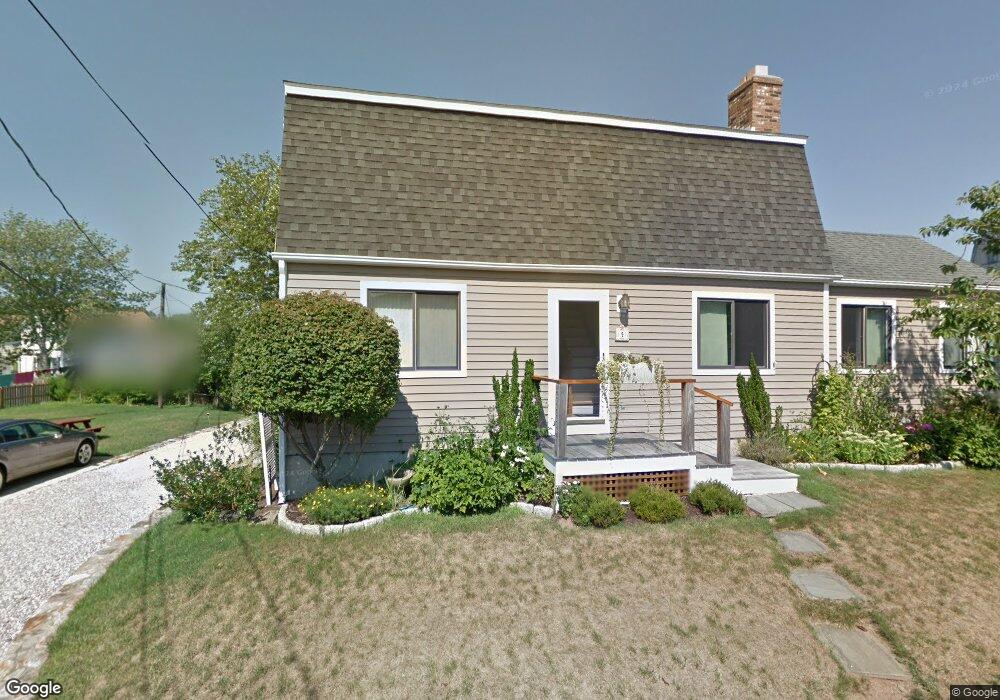
4 Waverly Rd Branford, CT 06405
Estimated Value: $744,000 - $949,017
4
Beds
3
Baths
2,244
Sq Ft
$396/Sq Ft
Est. Value
About This Home
This home is located at 4 Waverly Rd, Branford, CT 06405 and is currently estimated at $889,004, approximately $396 per square foot. 4 Waverly Rd is a home located in New Haven County with nearby schools including Francis Walsh Intermediate School, Branford High School, and East Shoreline Catholic Academy.
Ownership History
Date
Name
Owned For
Owner Type
Purchase Details
Closed on
Dec 7, 1994
Sold by
Delaney Edward J and Delaney Maria M
Bought by
Conklin Donald and Conklin Deborah
Current Estimated Value
Home Financials for this Owner
Home Financials are based on the most recent Mortgage that was taken out on this home.
Original Mortgage
$146,000
Interest Rate
8%
Mortgage Type
Unknown
Create a Home Valuation Report for This Property
The Home Valuation Report is an in-depth analysis detailing your home's value as well as a comparison with similar homes in the area
Home Values in the Area
Average Home Value in this Area
Purchase History
| Date | Buyer | Sale Price | Title Company |
|---|---|---|---|
| Conklin Donald | $183,000 | -- |
Source: Public Records
Mortgage History
| Date | Status | Borrower | Loan Amount |
|---|---|---|---|
| Closed | Conklin Donald | $144,500 | |
| Closed | Conklin Donald | $146,000 | |
| Previous Owner | Conklin Donald | $142,000 | |
| Previous Owner | Conklin Donald | $50,000 |
Source: Public Records
Tax History Compared to Growth
Tax History
| Year | Tax Paid | Tax Assessment Tax Assessment Total Assessment is a certain percentage of the fair market value that is determined by local assessors to be the total taxable value of land and additions on the property. | Land | Improvement |
|---|---|---|---|---|
| 2025 | $12,399 | $579,400 | $278,400 | $301,000 |
| 2024 | $9,985 | $327,600 | $153,800 | $173,800 |
| 2023 | $9,792 | $327,600 | $153,800 | $173,800 |
| 2022 | $9,648 | $327,600 | $153,800 | $173,800 |
| 2021 | $9,648 | $327,600 | $153,800 | $173,800 |
| 2020 | $9,474 | $327,600 | $153,800 | $173,800 |
| 2019 | $9,172 | $315,500 | $145,400 | $170,100 |
| 2018 | $9,036 | $315,500 | $145,400 | $170,100 |
| 2017 | $8,982 | $315,500 | $145,400 | $170,100 |
| 2016 | $8,530 | $311,200 | $145,400 | $165,800 |
| 2015 | $8,381 | $311,200 | $145,400 | $165,800 |
| 2014 | $8,434 | $321,400 | $153,800 | $167,600 |
Source: Public Records
Map
Nearby Homes
- 42 Waverly Rd
- 76 Limewood Ave
- 2 W Haycock Point Rd
- 29 Seaview Ave
- 40 Linden Shores
- 62 S Montowese St
- 10 Montgomery Pkwy
- 5 Maltby St
- 13 Fenway Rd
- 29 Crescent Bluff Ave
- 175 Pine Orchard Rd
- 74 Quarry Dock Rd
- 3 Bayview Ave
- 25 S Montowese St
- 15 River Rd
- 58 Quarry Dock Rd
- 10 Island View Ave
- 86 Pine Orchard Rd
- 29 Blackstone Ave
- 94 Summer Island Rd