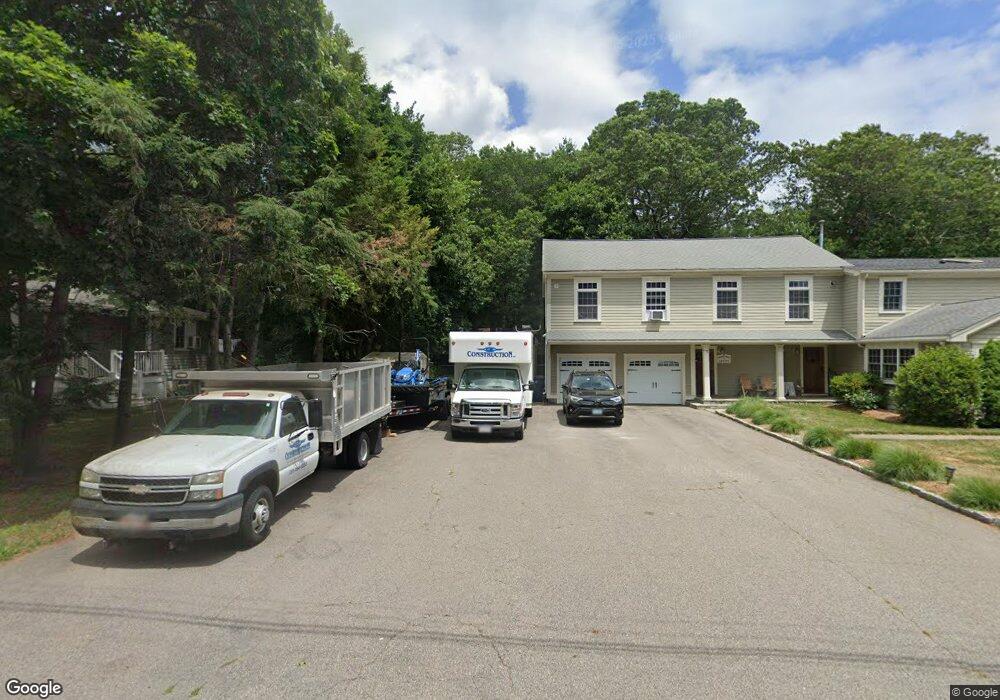
4 Wayside Ln Sharon, MA 02067
Estimated Value: $756,000 - $1,077,000
3
Beds
2
Baths
1,440
Sq Ft
$593/Sq Ft
Est. Value
About This Home
This home is located at 4 Wayside Ln, Sharon, MA 02067 and is currently estimated at $853,965, approximately $593 per square foot. 4 Wayside Ln is a home located in Norfolk County with nearby schools including Heights Elementary School, Sharon Middle School, and Sharon High School.
Ownership History
Date
Name
Owned For
Owner Type
Purchase Details
Closed on
Jul 17, 2012
Sold by
Hartwell Joseph I and Meinke Gretchen
Bought by
Meinke Gretchen
Current Estimated Value
Purchase Details
Closed on
Aug 28, 2000
Sold by
Stubbs Harold L and Stubbs Lucille B
Bought by
Harwell Joseph I
Home Financials for this Owner
Home Financials are based on the most recent Mortgage that was taken out on this home.
Original Mortgage
$299,200
Interest Rate
8.06%
Mortgage Type
Purchase Money Mortgage
Create a Home Valuation Report for This Property
The Home Valuation Report is an in-depth analysis detailing your home's value as well as a comparison with similar homes in the area
Home Values in the Area
Average Home Value in this Area
Purchase History
| Date | Buyer | Sale Price | Title Company |
|---|---|---|---|
| Meinke Gretchen | -- | -- | |
| Harwell Joseph I | $352,000 | -- |
Source: Public Records
Mortgage History
| Date | Status | Borrower | Loan Amount |
|---|---|---|---|
| Previous Owner | Harwell Joseph I | $299,200 |
Source: Public Records
Tax History
| Year | Tax Paid | Tax Assessment Tax Assessment Total Assessment is a certain percentage of the fair market value that is determined by local assessors to be the total taxable value of land and additions on the property. | Land | Improvement |
|---|---|---|---|---|
| 2025 | $11,664 | $667,300 | $403,200 | $264,100 |
| 2024 | $11,070 | $629,700 | $369,900 | $259,800 |
| 2023 | $10,862 | $584,300 | $345,900 | $238,400 |
| 2022 | $10,191 | $516,000 | $288,200 | $227,800 |
| 2021 | $10,074 | $493,100 | $271,700 | $221,400 |
| 2020 | $9,369 | $493,100 | $271,700 | $221,400 |
| 2019 | $9,253 | $476,700 | $240,400 | $236,300 |
| 2018 | $9,145 | $472,100 | $235,800 | $236,300 |
| 2017 | $8,962 | $456,800 | $220,500 | $236,300 |
| 2016 | $8,800 | $437,600 | $220,500 | $217,100 |
| 2015 | $8,232 | $405,500 | $202,200 | $203,300 |
| 2014 | $7,651 | $372,300 | $183,900 | $188,400 |
Source: Public Records
Map
Nearby Homes
- 27 Sandy Ridge Cir
- 5 Trowel Pond Shop Rd Unit C
- 58 Ames St
- 54 Depot St
- 29 Station St
- 277 Everett St
- 668 S Main St
- 180 Old Post Rd Unit 202
- 180 Old Post Rd Unit 206
- 180 Old Post Rd Unit 308
- 180 Old Post Rd Unit 201
- 180 Old Post Rd Unit 405
- 180 Old Post Rd Unit 207
- 32 Billings St Unit A
- 15 Paul Revere Rd
- Lot One Old Wolomolopoag St
- Lot Two Old Wolomolopoag St
- 63 Highland St
- 3 Wampanoag Rd
- 136 N Main St
Your Personal Tour Guide
Ask me questions while you tour the home.