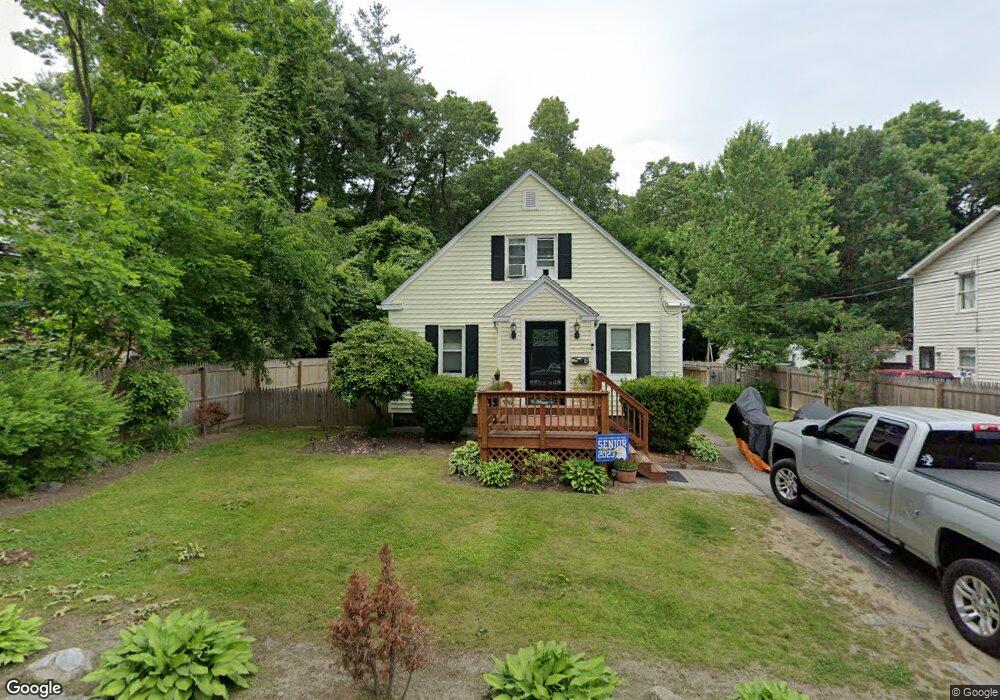
4 Wescott St Worcester, MA 01603
Webster Square NeighborhoodEstimated Value: $338,000 - $390,000
3
Beds
2
Baths
1,087
Sq Ft
$338/Sq Ft
Est. Value
About This Home
This home is located at 4 Wescott St, Worcester, MA 01603 and is currently estimated at $367,627, approximately $338 per square foot. 4 Wescott St is a home located in Worcester County with nearby schools including Tatnuck Magnet School, Chandler Magnet, and Jacob Hiatt Magnet School.
Ownership History
Date
Name
Owned For
Owner Type
Purchase Details
Closed on
Jun 28, 2007
Sold by
Dlj Mortgage Capital I
Bought by
Cousins Sylvia M
Current Estimated Value
Home Financials for this Owner
Home Financials are based on the most recent Mortgage that was taken out on this home.
Original Mortgage
$168,900
Outstanding Balance
$104,126
Interest Rate
6.24%
Mortgage Type
Purchase Money Mortgage
Estimated Equity
$263,501
Purchase Details
Closed on
Oct 20, 2006
Sold by
Salamone Daniel
Bought by
Dlj Mortgage Capital I
Purchase Details
Closed on
Nov 25, 2005
Sold by
Seymour Allen J
Bought by
Salamone Daniel
Home Financials for this Owner
Home Financials are based on the most recent Mortgage that was taken out on this home.
Original Mortgage
$216,000
Interest Rate
6.06%
Mortgage Type
Purchase Money Mortgage
Purchase Details
Closed on
Oct 26, 2004
Sold by
Sea Green Prop Llc
Bought by
Seymour Allen J
Purchase Details
Closed on
Aug 3, 2004
Sold by
Magnusson Judith A
Bought by
Mason Frances
Purchase Details
Closed on
Feb 1, 1996
Sold by
Mackenzie Gordon and Mackenzie Diana
Bought by
Magnusson Richard and Magnusson Judith
Home Financials for this Owner
Home Financials are based on the most recent Mortgage that was taken out on this home.
Original Mortgage
$87,000
Interest Rate
7.25%
Mortgage Type
Purchase Money Mortgage
Purchase Details
Closed on
Jul 24, 1991
Sold by
Ellis Timothy W
Bought by
Mackenzie Gordon C and Diane Mackenzie
Home Financials for this Owner
Home Financials are based on the most recent Mortgage that was taken out on this home.
Original Mortgage
$112,000
Interest Rate
9.58%
Mortgage Type
Purchase Money Mortgage
Purchase Details
Closed on
May 26, 1988
Sold by
Ellis Timothy W
Bought by
Ellis Timothy W
Create a Home Valuation Report for This Property
The Home Valuation Report is an in-depth analysis detailing your home's value as well as a comparison with similar homes in the area
Home Values in the Area
Average Home Value in this Area
Purchase History
| Date | Buyer | Sale Price | Title Company |
|---|---|---|---|
| Cousins Sylvia M | $169,900 | -- | |
| Dlj Mortgage Capital I | $231,903 | -- | |
| Salamone Daniel | $240,000 | -- | |
| Seymour Allen J | $248,000 | -- | |
| Mason Frances | $119,653 | -- | |
| Magnusson Richard | $87,000 | -- | |
| Mackenzie Gordon C | $112,000 | -- | |
| Ellis Timothy W | $3,000 | -- |
Source: Public Records
Mortgage History
| Date | Status | Borrower | Loan Amount |
|---|---|---|---|
| Open | Cousins Sylvia M | $168,900 | |
| Previous Owner | Salamone Daniel | $216,000 | |
| Previous Owner | Ellis Timothy W | $32,653 | |
| Previous Owner | Ellis Timothy W | $87,000 | |
| Previous Owner | Ellis Timothy W | $112,000 |
Source: Public Records
Tax History
| Year | Tax Paid | Tax Assessment Tax Assessment Total Assessment is a certain percentage of the fair market value that is determined by local assessors to be the total taxable value of land and additions on the property. | Land | Improvement |
|---|---|---|---|---|
| 2025 | $4,340 | $329,000 | $98,600 | $230,400 |
| 2024 | $4,239 | $308,300 | $98,600 | $209,700 |
| 2023 | $4,078 | $284,400 | $85,700 | $198,700 |
| 2022 | $3,731 | $245,300 | $68,600 | $176,700 |
| 2021 | $3,557 | $218,500 | $54,900 | $163,600 |
| 2020 | $3,471 | $204,200 | $54,500 | $149,700 |
| 2019 | $3,249 | $180,500 | $47,600 | $132,900 |
| 2018 | $3,230 | $170,800 | $47,600 | $123,200 |
| 2017 | $3,117 | $162,200 | $47,600 | $114,600 |
| 2016 | $3,098 | $150,300 | $34,100 | $116,200 |
| 2015 | $3,017 | $150,300 | $34,100 | $116,200 |
| 2014 | $2,937 | $150,300 | $34,100 | $116,200 |
Source: Public Records
Map
Nearby Homes
- 34 Scandinavia Ave
- 57 1st St
- 11 Timrod Dr
- 66 Ledgecrest Dr
- 215 Mill St Unit 113
- 215 Mill St Unit 115
- 5 Swan Ave
- 56 Goddard Memorial Dr
- 37 Gates Rd
- 32 Goddard Memorial Dr
- 415 Mill St
- 34 Rosslare Dr Unit 108
- 27 Montague St
- 13 Merchant St
- 15 Circuit Ave E
- 211 June St Unit 2
- 55 Grandview Ave
- 1511 Main St Unit C405
- 23 Lakewood St
- 9 Englewood Ave
Your Personal Tour Guide
Ask me questions while you tour the home.