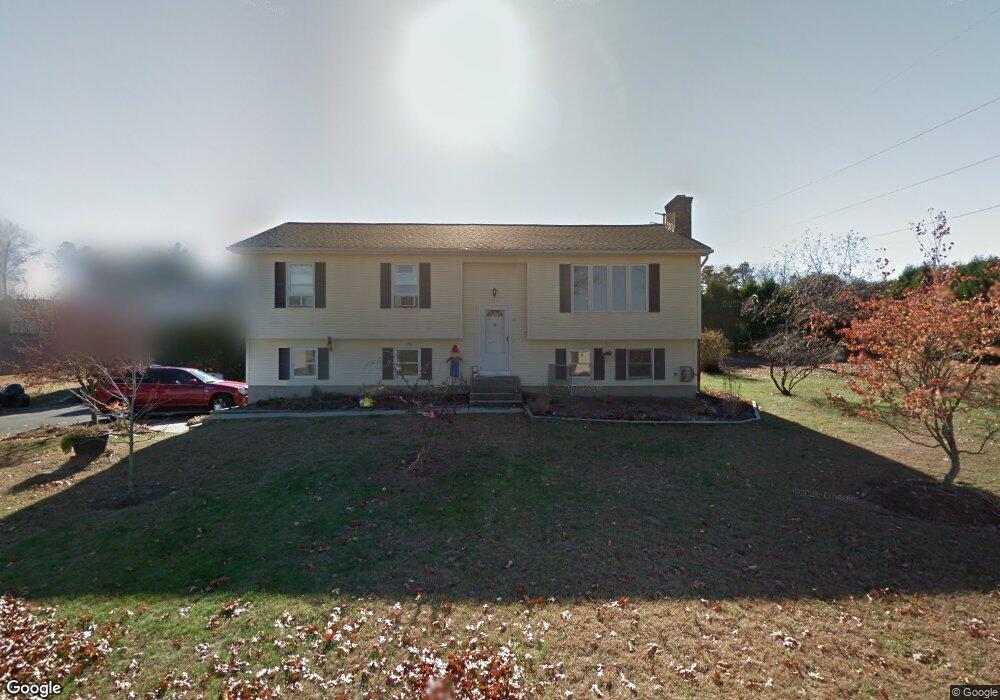
4 Windsor Cir Easthampton, MA 01027
Estimated Value: $436,000 - $482,000
3
Beds
4
Baths
1,242
Sq Ft
$361/Sq Ft
Est. Value
About This Home
This home is located at 4 Windsor Cir, Easthampton, MA 01027 and is currently estimated at $448,318, approximately $360 per square foot. 4 Windsor Cir is a home located in Hampshire County with nearby schools including Easthampton High School, Calvary Baptist Christian School, and New England Adolescent Research Institute.
Ownership History
Date
Name
Owned For
Owner Type
Purchase Details
Closed on
May 29, 2025
Sold by
Dawn M Carson Irt and Boyle
Bought by
Carson Dawn M
Current Estimated Value
Purchase Details
Closed on
Aug 22, 2013
Sold by
Boyle Sharon K
Bought by
Dawn M Carson Irt and Boyle
Purchase Details
Closed on
May 28, 1997
Sold by
Salazar Juan C and Salazar Amelia Aries
Bought by
Fletcher Harold and Fletcher Ruth
Purchase Details
Closed on
Jul 28, 1995
Sold by
Gawle Julia A
Bought by
Salazar Amelia Aries and Salazar Juan Carlos
Home Financials for this Owner
Home Financials are based on the most recent Mortgage that was taken out on this home.
Original Mortgage
$124,336
Interest Rate
7.56%
Mortgage Type
Purchase Money Mortgage
Create a Home Valuation Report for This Property
The Home Valuation Report is an in-depth analysis detailing your home's value as well as a comparison with similar homes in the area
Home Values in the Area
Average Home Value in this Area
Purchase History
| Date | Buyer | Sale Price | Title Company |
|---|---|---|---|
| Carson Dawn M | -- | None Available | |
| Carson Dawn M | -- | None Available | |
| Dawn M Carson Irt | -- | -- | |
| Dawn M Carson Irt | -- | -- | |
| Fletcher Harold | $129,000 | -- | |
| Fletcher Harold | $129,000 | -- | |
| Salazar Amelia Aries | $125,000 | -- | |
| Salazar Amelia Aries | $125,000 | -- |
Source: Public Records
Mortgage History
| Date | Status | Borrower | Loan Amount |
|---|---|---|---|
| Previous Owner | Salazar Amelia Aries | $124,336 |
Source: Public Records
Tax History Compared to Growth
Tax History
| Year | Tax Paid | Tax Assessment Tax Assessment Total Assessment is a certain percentage of the fair market value that is determined by local assessors to be the total taxable value of land and additions on the property. | Land | Improvement |
|---|---|---|---|---|
| 2025 | $5,330 | $389,900 | $114,600 | $275,300 |
| 2024 | $5,174 | $381,600 | $111,300 | $270,300 |
| 2023 | $3,914 | $267,200 | $87,700 | $179,500 |
| 2022 | $4,417 | $267,200 | $87,700 | $179,500 |
| 2021 | $4,848 | $276,400 | $87,700 | $188,700 |
| 2020 | $4,745 | $267,200 | $87,700 | $179,500 |
| 2019 | $4,131 | $267,200 | $87,700 | $179,500 |
| 2018 | $4,099 | $256,200 | $82,600 | $173,600 |
| 2017 | $4,007 | $247,200 | $79,400 | $167,800 |
| 2016 | $3,854 | $247,200 | $79,400 | $167,800 |
| 2015 | $3,745 | $247,200 | $79,400 | $167,800 |
Source: Public Records
Map
Nearby Homes