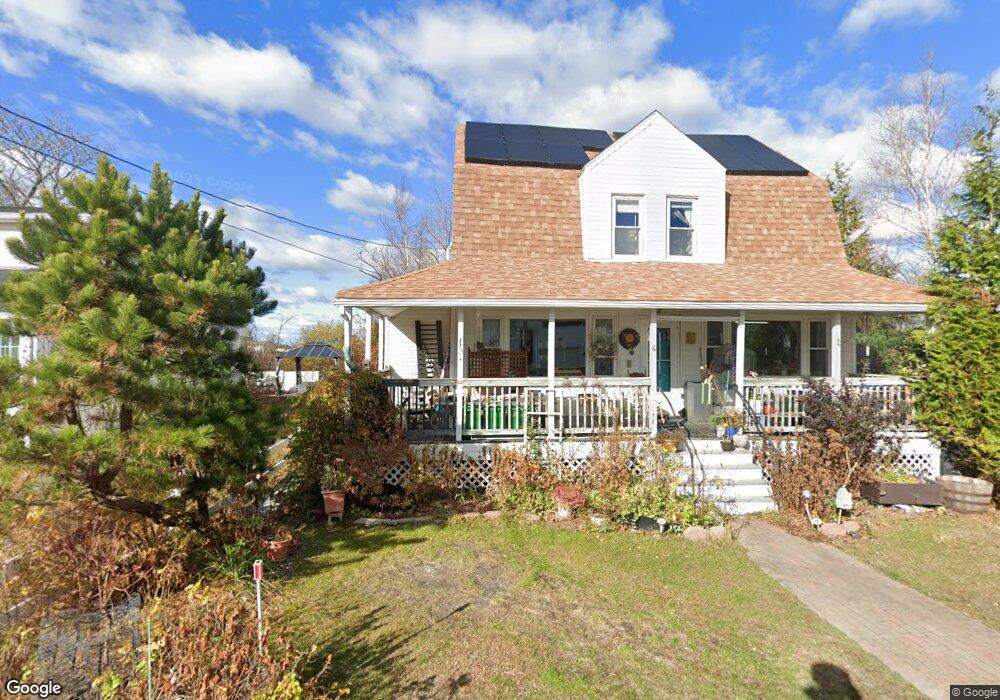
4 Wyman Greely Rd Salisbury, MA 01952
Estimated Value: $631,474 - $861,000
3
Beds
2
Baths
1,552
Sq Ft
$461/Sq Ft
Est. Value
About This Home
This home is located at 4 Wyman Greely Rd, Salisbury, MA 01952 and is currently estimated at $715,619, approximately $461 per square foot. 4 Wyman Greely Rd is a home located in Essex County with nearby schools including Triton Regional High School.
Ownership History
Date
Name
Owned For
Owner Type
Purchase Details
Closed on
May 15, 2024
Sold by
Kochanski Eva M
Bought by
Eva Marie Kochanski Ret and Kulig
Current Estimated Value
Purchase Details
Closed on
May 27, 2010
Sold by
Reed Tammy A
Bought by
Kochanski Eva M
Home Financials for this Owner
Home Financials are based on the most recent Mortgage that was taken out on this home.
Original Mortgage
$100,000
Interest Rate
5.13%
Mortgage Type
Purchase Money Mortgage
Purchase Details
Closed on
Jul 8, 2002
Sold by
Andrews George and Andrews Cheryl A
Bought by
Dobson Sean C and Reed Tammy A
Purchase Details
Closed on
Jul 6, 1998
Sold by
Oloughlin Kevin and Oloughlin Nancy Lynne
Bought by
Andrews George W and Andrews Cheryl
Create a Home Valuation Report for This Property
The Home Valuation Report is an in-depth analysis detailing your home's value as well as a comparison with similar homes in the area
Home Values in the Area
Average Home Value in this Area
Purchase History
| Date | Buyer | Sale Price | Title Company |
|---|---|---|---|
| Eva Marie Kochanski Ret | -- | None Available | |
| Eva Marie Kochanski Ret | -- | None Available | |
| Kochanski Eva M | $280,000 | -- | |
| Reed Tammy A | -- | -- | |
| Dobson Sean C | $287,000 | -- | |
| Andrews George W | $142,500 | -- | |
| Kochanski Eva M | $280,000 | -- | |
| Dobson Sean C | $287,000 | -- | |
| Andrews George W | $142,500 | -- |
Source: Public Records
Mortgage History
| Date | Status | Borrower | Loan Amount |
|---|---|---|---|
| Previous Owner | Andrews George W | $100,000 |
Source: Public Records
Tax History Compared to Growth
Tax History
| Year | Tax Paid | Tax Assessment Tax Assessment Total Assessment is a certain percentage of the fair market value that is determined by local assessors to be the total taxable value of land and additions on the property. | Land | Improvement |
|---|---|---|---|---|
| 2025 | $5,255 | $521,300 | $253,100 | $268,200 |
| 2024 | $5,285 | $505,700 | $253,100 | $252,600 |
| 2023 | $4,646 | $430,200 | $202,500 | $227,700 |
| 2022 | $4,512 | $405,000 | $185,600 | $219,400 |
| 2021 | $4,349 | $386,200 | $185,600 | $200,600 |
| 2020 | $4,035 | $352,100 | $177,900 | $174,200 |
| 2019 | $3,787 | $319,300 | $156,700 | $162,600 |
| 2018 | $3,704 | $314,400 | $155,700 | $158,700 |
| 2017 | $3,512 | $294,600 | $149,400 | $145,200 |
| 2016 | $3,361 | $288,000 | $149,400 | $138,600 |
| 2015 | $3,208 | $273,000 | $149,400 | $123,600 |
Source: Public Records
Map
Nearby Homes
- 432 N End Blvd
- 10 Liberty St
- 479 N End Blvd
- 492 N End Blvd
- 498 N End Blvd
- 522 N End Blvd
- 188 N End Blvd Unit 3
- 178 N End Blvd Unit A
- 178 N End Blvd Unit C
- 178 N End Blvd Unit F
- 168 N End Blvd
- 595 N End Blvd Unit 2
- 308 State Route 286 Unit Lot 73
- 308 State Route 286 Unit Lot 108
- 308 State Route 286 Unit Lot 87
- 98 Central Ave
- 308 Route 286 Unit 77
- 308 Route 286 Unit Lot 58
- 312 S Main St
- 38-40 Central Ave
- 6 Wyman Greely Rd
- 2 Wyman Greely Rd
- 3 Wyman Greely Rd
- 1 Wyman Greely Rd
- 5 Wyman Greely Rd
- 8 Wyman Greely Rd
- 387 N End Blvd
- 387 N End Blvd (1 Yr Lease) Unit 2
- 387 N End Blvd Unit 1
- 387 N End Blvd Unit 2
- 383 N End Blvd
- 7 Wyman Greely Rd
- 385 North End Blvd
- 381 N End Blvd
- 387 North End Blvd
- 381 North End Blvd
- 2 Coulson-Pratt Dr Unit 2
- 2 Coulson Pratt Dr
- 391 North End Blvd
- 379 N End Blvd Unit 2