
Landlord's Agent in 2024
JIAXING LIAO
Skyview Management LLc
(646) 286-2001
1 in this area
1 Total Sale
Estimated Value: $1,421,000 - $1,755,000
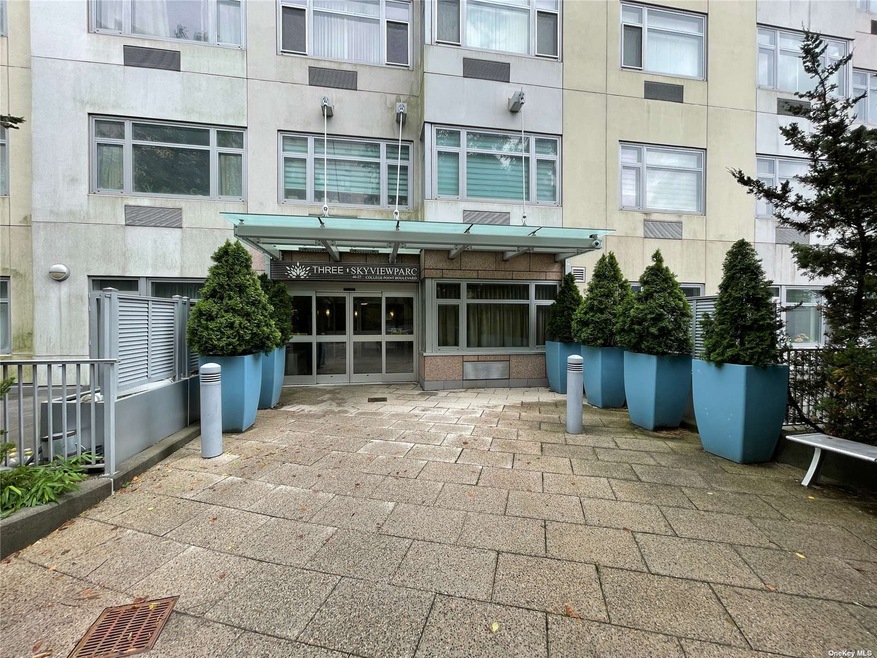
This home is located at 40- 22 College Point Blvd Unit 8R, Flushing, NY 11354 since 25 June 2024 and is currently priced at $1,557,410. This property was built in 2011. 40- 22 College Point Blvd Unit 8R is a home located in Queens County with nearby schools including P.S. 20 John Bowne Elementary, Flushing High School, and Promise Christian Academy.
Last Agent to Rent the Property
Skyview Management LLc Brokerage Phone: 718-886-8899 License #10401326418 Listed on: 06/25/2024
| Date | Buyer | Sale Price | Title Company |
|---|---|---|---|
| Chin Huan Lun | -- | -- | |
| Chin Huan Lun | -- | -- | |
| Chin Yu Ping | -- | -- | |
| Chin Yu Ping | $1,320,000 | -- | |
| Kim Ronald Tae Sok | $1,030,000 | -- |
| Date | Status | Borrower | Loan Amount |
|---|---|---|---|
| Previous Owner | Kim Ronald Tae Sok | $618,000 |
| Date | Event | Price | List to Sale | Price per Sq Ft |
|---|---|---|---|---|
| 09/01/2024 09/01/24 | Rented | $5,200 | 0.0% | -- |
| 06/25/2024 06/25/24 | For Rent | $5,200 | -- | -- |
| Year | Tax Paid | Tax Assessment Tax Assessment Total Assessment is a certain percentage of the fair market value that is determined by local assessors to be the total taxable value of land and additions on the property. | Land | Improvement |
|---|---|---|---|---|
| 2025 | $7,914 | $109,472 | $754 | $108,718 |
| 2024 | $7,914 | $105,071 | $754 | $104,317 |
| 2023 | $5,257 | $104,141 | $754 | $103,387 |
| 2022 | $2,576 | $108,354 | $754 | $107,600 |
| 2021 | $80 | $89,682 | $754 | $88,928 |
| 2020 | $82 | $107,394 | $754 | $106,640 |
| 2019 | $83 | $105,947 | $754 | $105,193 |
| 2018 | $83 | $92,824 | $754 | $92,070 |
| 2017 | $11,399 | $89,625 | $754 | $88,871 |
| 2016 | $84 | $89,625 | $754 | $88,871 |
| 2015 | $66 | $86,593 | $754 | $85,839 |
| 2014 | $66 | $85,908 | $754 | $85,154 |
Landlord's Agent in 2024
JIAXING LIAO
Skyview Management LLc
(646) 286-2001
1 in this area
1 Total Sale
C
Tenant's Agent in 2024
Cody But
Winzone Realty Inc
(917) 280-6655
2 Total Sales
Source: OneKey® MLS
MLS Number: KEY3561413
APN: 05066-1047
Disclaimer: Certain information contained herein is derived from information provided by parties other than Homes.com. All information provided is deemed reliable, but is not guaranteed to be accurate and should be independently verified.
![]() The data relating to real estate for sale or lease on this web site comes in part from OneKey® MLS. Real estate listings held by brokerage firms other than Ten-X are marked with the OneKey® MLS logo or an abbreviated logo and detailed information about them includes the name of the listing broker.
The data relating to real estate for sale or lease on this web site comes in part from OneKey® MLS. Real estate listings held by brokerage firms other than Ten-X are marked with the OneKey® MLS logo or an abbreviated logo and detailed information about them includes the name of the listing broker.
IDX information is provided exclusively for personal, non-commercial use, and may not be used for any purpose other than to identify prospective properties consumers may be interested in purchasing.
Information is deemed reliable but not guaranteed.
Copyright 2025 OneKey® MLS. All rights reserved.