40 Alden St Foxboro, MA 02035
Estimated Value: $624,000 - $752,000
3
Beds
2
Baths
1,550
Sq Ft
$434/Sq Ft
Est. Value
About This Home
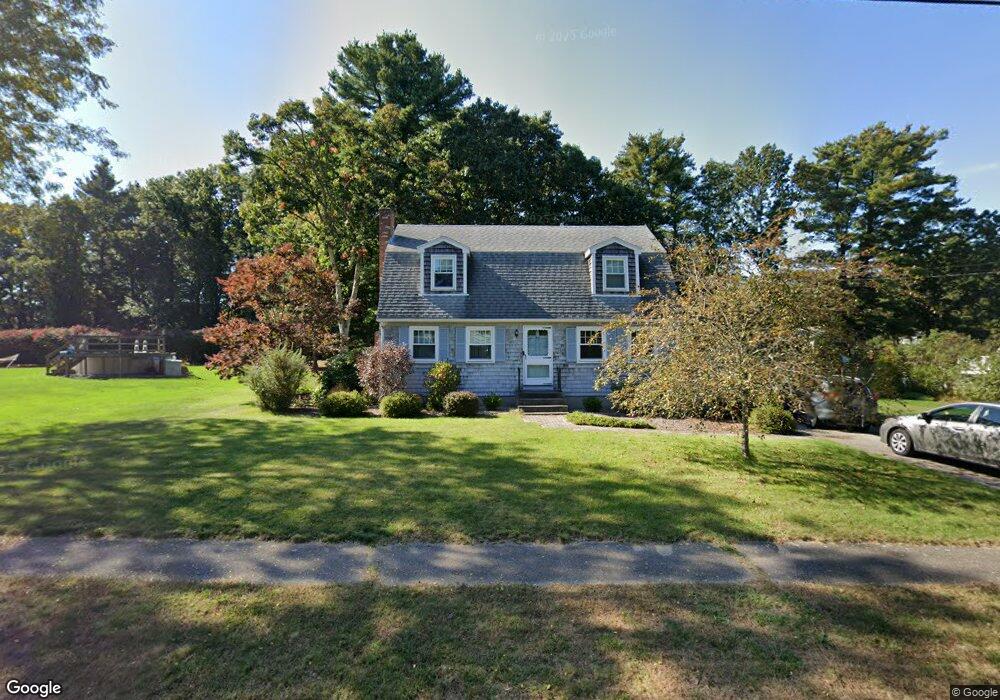
This home is located at 40 Alden St, Foxboro, MA 02035 and is currently estimated at $673,110, approximately $434 per square foot. 40 Alden St is a home located in Norfolk County with nearby schools including Foxborough High School, Foxborough Regional Charter School, and Hands-On-Montessori School.
Ownership History
Date
Name
Owned For
Owner Type
Purchase Details
Closed on
Oct 25, 1991
Sold by
Emody Kenneth J and Emody Joann M
Bought by
Richardi Robert J and Richardi Nancy L
Current Estimated Value
Home Financials for this Owner
Home Financials are based on the most recent Mortgage that was taken out on this home.
Original Mortgage
$124,000
Interest Rate
8.98%
Mortgage Type
Purchase Money Mortgage
Create a Home Valuation Report for This Property
The Home Valuation Report is an in-depth analysis detailing your home's value as well as a comparison with similar homes in the area
Home Values in the Area
Average Home Value in this Area
Purchase History
| Date | Buyer | Sale Price | Title Company |
|---|---|---|---|
| Richardi Robert J | $155,000 | -- |
Source: Public Records
Mortgage History
| Date | Status | Borrower | Loan Amount |
|---|---|---|---|
| Closed | Richardi Robert J | $122,000 | |
| Closed | Richardi Robert J | $124,000 |
Source: Public Records
Tax History Compared to Growth
Tax History
| Year | Tax Paid | Tax Assessment Tax Assessment Total Assessment is a certain percentage of the fair market value that is determined by local assessors to be the total taxable value of land and additions on the property. | Land | Improvement |
|---|---|---|---|---|
| 2025 | $6,277 | $474,800 | $217,400 | $257,400 |
| 2024 | $6,202 | $459,100 | $217,400 | $241,700 |
| 2023 | $5,999 | $422,200 | $207,000 | $215,200 |
| 2022 | $5,828 | $401,400 | $198,000 | $203,400 |
| 2021 | $5,597 | $379,700 | $180,000 | $199,700 |
| 2020 | $5,435 | $373,000 | $180,000 | $193,000 |
| 2019 | $5,188 | $352,900 | $171,400 | $181,500 |
| 2018 | $5,356 | $367,600 | $171,400 | $196,200 |
| 2017 | $5,160 | $343,100 | $160,200 | $182,900 |
| 2016 | $4,994 | $337,000 | $154,100 | $182,900 |
| 2015 | $4,900 | $322,600 | $130,200 | $192,400 |
| 2014 | $4,740 | $316,200 | $127,600 | $188,600 |
Source: Public Records
Map
Nearby Homes
- 67 Morse St
- 12 Community Way
- 5 Lauren Ln
- 9 Independence Dr Unit 9
- 35 Independence Dr Unit 35
- 124 E Belcher Rd
- 132 Cannon Forge Dr
- 261 East St
- 170 Cannon Forge Dr
- 18 Winter St Unit E
- 619 N Main St
- 11 W Belcher Rd Unit 5
- 60 King St
- 44 Angell St Unit 44
- 28 Angell St
- 194 Central St
- 84 Cocasset St Unit A6
- 25 Winter St
- 19 Fuller Rd Unit 7
- 89 Oak St