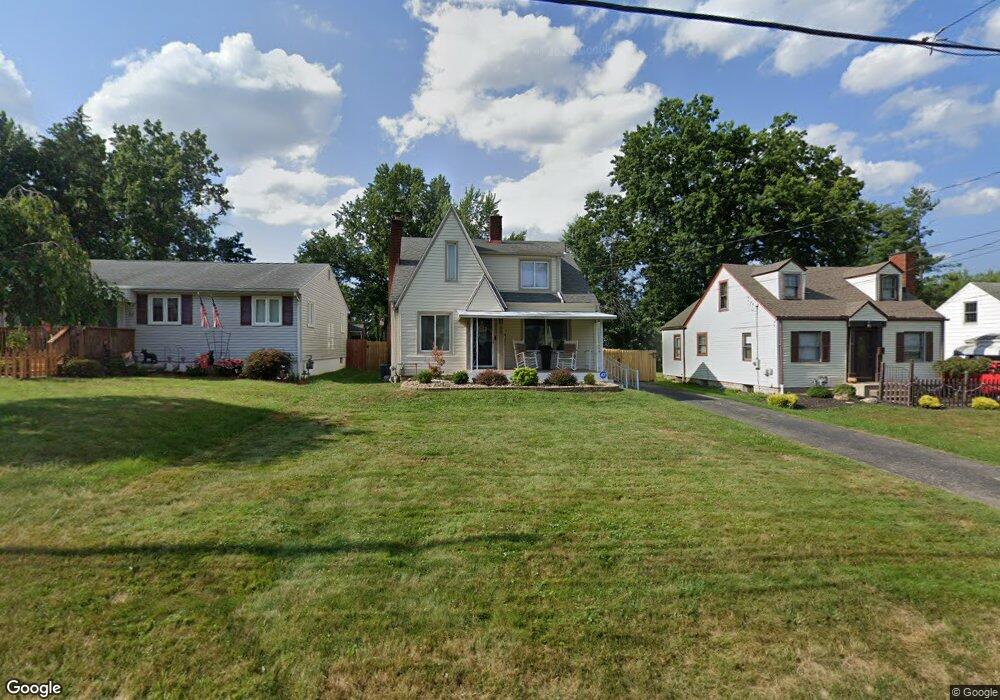
40 Arlene Ave Youngstown, OH 44512
Estimated Value: $119,000 - $155,000
4
Beds
1
Bath
1,582
Sq Ft
$84/Sq Ft
Est. Value
About This Home
This home is located at 40 Arlene Ave, Youngstown, OH 44512 and is currently estimated at $133,659, approximately $84 per square foot. 40 Arlene Ave is a home located in Mahoning County with nearby schools including Boardman Glenwood Junior High School, Boardman High School, and Horizon Science Academy - Youngstown.
Ownership History
Date
Name
Owned For
Owner Type
Purchase Details
Closed on
Dec 3, 2019
Sold by
Pedraza Jesus M and Pedraza Maria C
Bought by
Gonzalez Christine and Butler Nathan K
Current Estimated Value
Home Financials for this Owner
Home Financials are based on the most recent Mortgage that was taken out on this home.
Original Mortgage
$62,448
Outstanding Balance
$55,470
Interest Rate
3.99%
Mortgage Type
FHA
Estimated Equity
$78,189
Purchase Details
Closed on
Jul 1, 2019
Sold by
Pedraza Ruben A
Bought by
Pedraza Jesus M and Pedraza Maria C
Purchase Details
Closed on
Jan 29, 2009
Sold by
Wilkinson Joan M and Wilkinson Garth
Bought by
Pedraza Ruben A
Home Financials for this Owner
Home Financials are based on the most recent Mortgage that was taken out on this home.
Original Mortgage
$68,440
Interest Rate
5.03%
Mortgage Type
VA
Purchase Details
Closed on
Jan 28, 1994
Bought by
Marino Joan M
Create a Home Valuation Report for This Property
The Home Valuation Report is an in-depth analysis detailing your home's value as well as a comparison with similar homes in the area
Home Values in the Area
Average Home Value in this Area
Purchase History
| Date | Buyer | Sale Price | Title Company |
|---|---|---|---|
| Gonzalez Christine | $63,600 | None Available | |
| Pedraza Jesus M | -- | None Available | |
| Pedraza Ruben A | $67,000 | Attorney | |
| Marino Joan M | $59,500 | -- |
Source: Public Records
Mortgage History
| Date | Status | Borrower | Loan Amount |
|---|---|---|---|
| Open | Gonzalez Christine | $62,448 | |
| Previous Owner | Pedraza Ruben A | $68,440 |
Source: Public Records
Tax History Compared to Growth
Tax History
| Year | Tax Paid | Tax Assessment Tax Assessment Total Assessment is a certain percentage of the fair market value that is determined by local assessors to be the total taxable value of land and additions on the property. | Land | Improvement |
|---|---|---|---|---|
| 2024 | $1,914 | $37,640 | $3,780 | $33,860 |
| 2023 | $1,889 | $37,640 | $3,780 | $33,860 |
| 2022 | $1,515 | $23,010 | $3,770 | $19,240 |
| 2021 | $1,516 | $23,010 | $3,770 | $19,240 |
| 2020 | $1,524 | $23,010 | $3,770 | $19,240 |
| 2019 | $1,510 | $20,190 | $3,310 | $16,880 |
| 2018 | $1,306 | $20,190 | $3,310 | $16,880 |
| 2017 | $1,330 | $20,190 | $3,310 | $16,880 |
| 2016 | $1,368 | $21,190 | $3,590 | $17,600 |
| 2015 | $1,341 | $21,190 | $3,590 | $17,600 |
| 2014 | $1,345 | $21,190 | $3,590 | $17,600 |
| 2013 | $1,328 | $21,190 | $3,590 | $17,600 |
Source: Public Records
Map
Nearby Homes
- 44 Gertrude Ave
- 149 Argyle Ave
- 81 Melrose Ave
- 169 Wolcott Dr
- 167 Afton Ave
- 197 Mathews Rd Unit B
- 127 Melrose Ave
- 103 Wildwood Dr
- 235 Wolcott Dr
- 0 Mathews Rd Unit 5038026
- 6001 Applecrest Dr
- 26 Marlindale Ave
- 6511 Pembrooke Place
- 329 Afton Ave
- 175 Homestead Dr
- 96 Aylesboro Ave
- 642 Oakridge Dr
- 242 Oakley Ave
- 28 Terrace Dr
- 6726 Glendale Ave