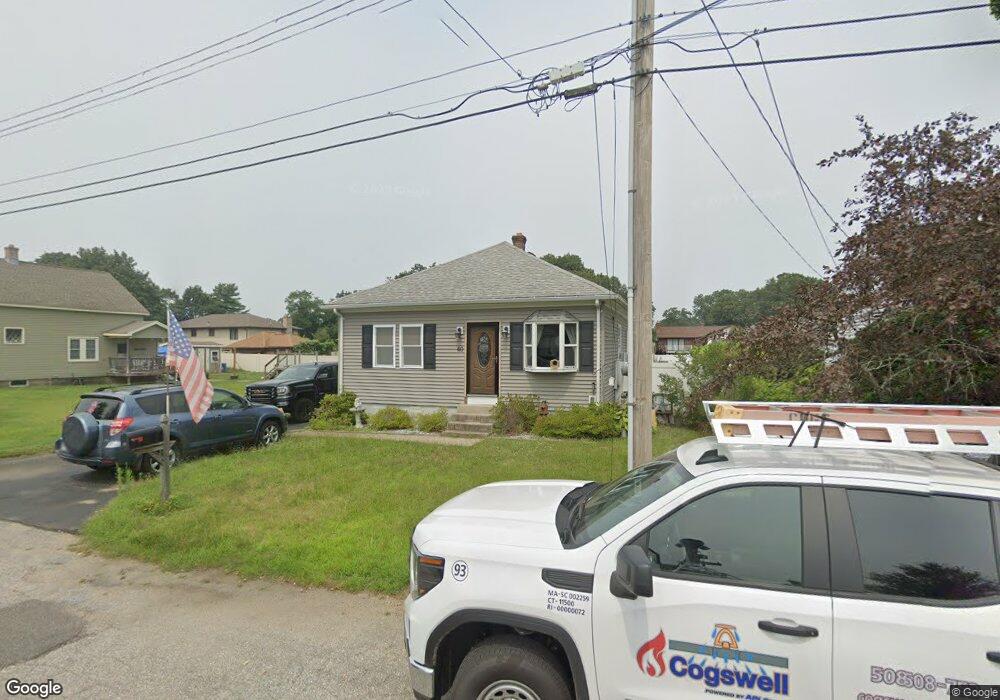
40 Belmont St Ludlow, MA 01056
Estimated Value: $230,000 - $295,000
2
Beds
1
Bath
936
Sq Ft
$289/Sq Ft
Est. Value
About This Home
This home is located at 40 Belmont St, Ludlow, MA 01056 and is currently estimated at $270,104, approximately $288 per square foot. 40 Belmont St is a home located in Hampden County with nearby schools including East Street Elementary School, Chapin Street Elementary School, and Paul R. Baird Middle School.
Ownership History
Date
Name
Owned For
Owner Type
Purchase Details
Closed on
Apr 30, 2009
Sold by
Mckeon Mary F
Bought by
Smith Bradley A and Baldarelli Kristin L
Current Estimated Value
Home Financials for this Owner
Home Financials are based on the most recent Mortgage that was taken out on this home.
Original Mortgage
$120,619
Outstanding Balance
$76,251
Interest Rate
4.86%
Mortgage Type
Purchase Money Mortgage
Estimated Equity
$193,853
Create a Home Valuation Report for This Property
The Home Valuation Report is an in-depth analysis detailing your home's value as well as a comparison with similar homes in the area
Home Values in the Area
Average Home Value in this Area
Purchase History
| Date | Buyer | Sale Price | Title Company |
|---|---|---|---|
| Smith Bradley A | $124,350 | -- |
Source: Public Records
Mortgage History
| Date | Status | Borrower | Loan Amount |
|---|---|---|---|
| Open | Smith Bradley A | $120,619 |
Source: Public Records
Tax History Compared to Growth
Tax History
| Year | Tax Paid | Tax Assessment Tax Assessment Total Assessment is a certain percentage of the fair market value that is determined by local assessors to be the total taxable value of land and additions on the property. | Land | Improvement |
|---|---|---|---|---|
| 2025 | $4,133 | $238,200 | $84,800 | $153,400 |
| 2024 | $3,969 | $219,400 | $84,800 | $134,600 |
| 2023 | $3,824 | $196,000 | $77,600 | $118,400 |
| 2022 | $3,454 | $172,800 | $71,100 | $101,700 |
| 2021 | $3,417 | $162,100 | $67,900 | $94,200 |
| 2020 | $3,277 | $158,900 | $66,900 | $92,000 |
| 2019 | $3,032 | $153,000 | $66,200 | $86,800 |
| 2018 | $2,852 | $150,000 | $66,200 | $83,800 |
| 2017 | $2,787 | $150,400 | $64,900 | $85,500 |
| 2016 | $2,625 | $144,800 | $63,600 | $81,200 |
| 2015 | $2,467 | $142,700 | $63,000 | $79,700 |
Source: Public Records
Map
Nearby Homes
- 0 Fuller St Unit 73409741
- 70 Fuller St
- 84 Fuller St Unit 1
- 98 Fuller St Unit 32
- 42 Loopley St
- 60 Loopley St
- 32 White St
- 61 Massachusetts Ave
- 298 Main St
- 295 Main St
- 24 Elm St
- 33 Grimard St
- 517 Ideal Ln Unit 401
- 184 Howard St
- 0 Center St Unit 73415933
- 201 Main St
- 166-168 Main St
- 166 Kendall St
- 41 Deroche Cir
- 96 Lyons St