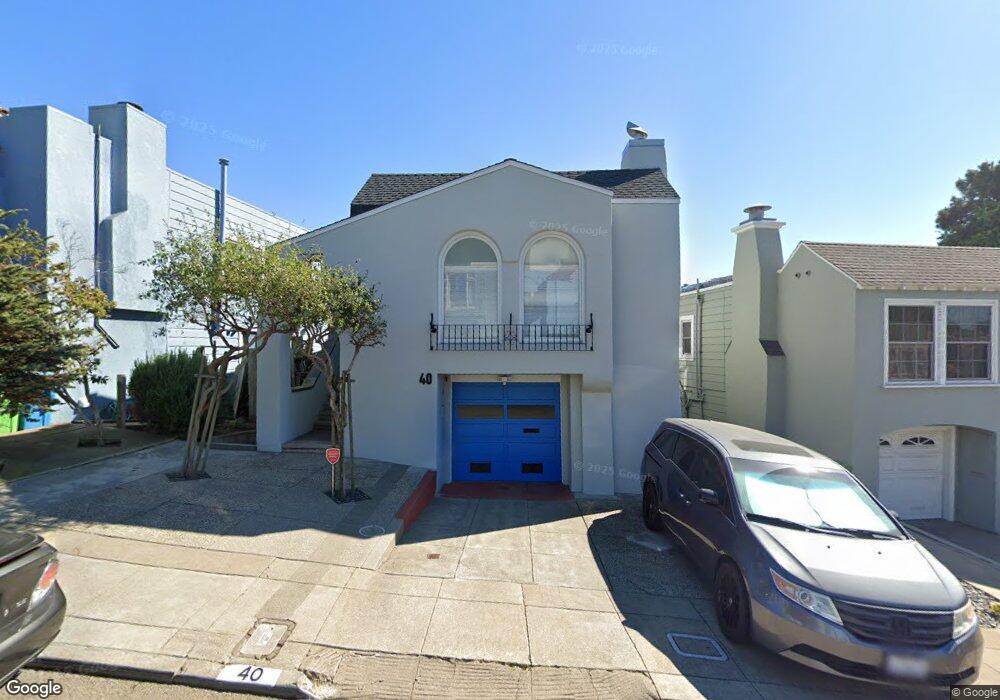
40 Benton Ave San Francisco, CA 94112
Bernal Heights NeighborhoodEstimated Value: $1,861,000 - $2,137,000
5
Beds
3
Baths
2,800
Sq Ft
$696/Sq Ft
Est. Value
About This Home
This home is located at 40 Benton Ave, San Francisco, CA 94112 and is currently estimated at $1,948,344, approximately $695 per square foot. 40 Benton Ave is a home located in San Francisco County with nearby schools including Serra (Junipero) Elementary School, Hoover (Herbert) Middle School, and Cornerstone Academy.
Ownership History
Date
Name
Owned For
Owner Type
Purchase Details
Closed on
Apr 3, 2007
Sold by
Moyrong Oliver P and Tomas Joyce M
Bought by
Moyrong Oliver P and Tomas Joyce M
Current Estimated Value
Purchase Details
Closed on
Dec 2, 2004
Sold by
Shek Luan Shee and Tong Kok Ting
Bought by
Moyrong Oliver P and Tomas Joyce M
Home Financials for this Owner
Home Financials are based on the most recent Mortgage that was taken out on this home.
Original Mortgage
$712,500
Outstanding Balance
$354,681
Interest Rate
5.64%
Mortgage Type
Stand Alone First
Estimated Equity
$1,593,663
Purchase Details
Closed on
Apr 9, 2004
Sold by
Boyd Robert C and Yamamoto Midori
Bought by
Shek Luen Shee and Tong Kok Ting
Home Financials for this Owner
Home Financials are based on the most recent Mortgage that was taken out on this home.
Original Mortgage
$446,000
Interest Rate
4.25%
Mortgage Type
Purchase Money Mortgage
Create a Home Valuation Report for This Property
The Home Valuation Report is an in-depth analysis detailing your home's value as well as a comparison with similar homes in the area
Home Values in the Area
Average Home Value in this Area
Purchase History
| Date | Buyer | Sale Price | Title Company |
|---|---|---|---|
| Moyrong Oliver P | -- | Chicago Title Co | |
| Moyrong Oliver P | $950,000 | Fidelity National Title Co | |
| Shek Luen Shee | $595,000 | Fidelity National Title Co |
Source: Public Records
Mortgage History
| Date | Status | Borrower | Loan Amount |
|---|---|---|---|
| Open | Moyrong Oliver P | $712,500 | |
| Previous Owner | Shek Luen Shee | $446,000 |
Source: Public Records
Tax History Compared to Growth
Tax History
| Year | Tax Paid | Tax Assessment Tax Assessment Total Assessment is a certain percentage of the fair market value that is determined by local assessors to be the total taxable value of land and additions on the property. | Land | Improvement |
|---|---|---|---|---|
| 2025 | $15,997 | $1,324,201 | $794,522 | $529,679 |
| 2024 | $15,997 | $1,298,238 | $778,944 | $519,294 |
| 2023 | $15,757 | $1,272,918 | $763,671 | $509,112 |
| 2022 | $15,455 | $1,247,970 | $748,698 | $499,130 |
| 2021 | $15,182 | $1,223,515 | $734,018 | $489,497 |
| 2020 | $15,304 | $1,211,076 | $726,492 | $484,584 |
| 2019 | $14,782 | $1,187,336 | $712,248 | $475,088 |
| 2018 | $14,282 | $1,164,061 | $698,283 | $465,778 |
| 2017 | $13,816 | $1,141,243 | $684,592 | $456,651 |
| 2016 | $13,586 | $1,118,872 | $671,169 | $447,703 |
| 2015 | $13,415 | $1,102,070 | $661,088 | $440,982 |
| 2014 | $12,355 | $1,020,257 | $612,000 | $408,257 |
Source: Public Records
Map
Nearby Homes
- 447 Justin Dr
- 4039-4041 Mission St
- 201 Congdon St
- 70 Justin Dr
- 447 Silver Ave
- 87 Maynard St
- 125 Leese St
- 111 Richland Ave
- 3755-3759 Mission St
- 474 Arlington St Unit 478
- 44 Maynard St
- 35 Admiral Ave
- 106 Madrid St
- 266-268 Arlington St
- 360 Laidley St Unit 362
- 141 Porter St
- 8 Mateo St
- 132 Bache St
- 200 Cayuga Ave
- 314 Park St