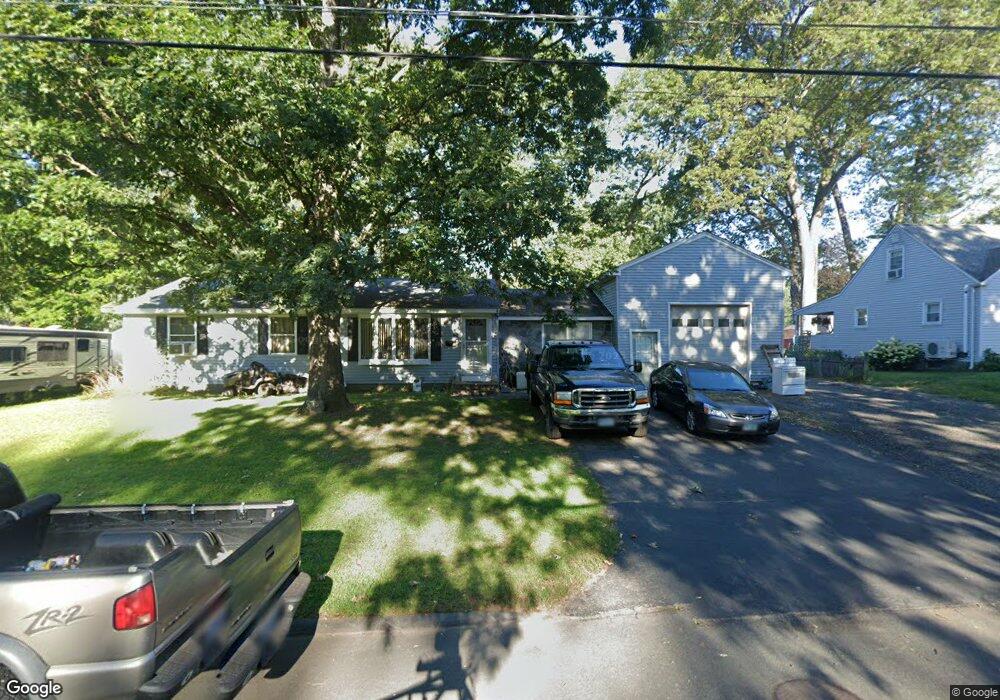
40 Burnham St Enfield, CT 06082
Estimated Value: $310,000 - $344,000
3
Beds
2
Baths
1,302
Sq Ft
$254/Sq Ft
Est. Value
About This Home
This home is located at 40 Burnham St, Enfield, CT 06082 and is currently estimated at $331,082, approximately $254 per square foot. 40 Burnham St is a home located in Hartford County with nearby schools including Edgar H. Parkman School, Enfield Street Elementary School, and Enfield High School.
Ownership History
Date
Name
Owned For
Owner Type
Purchase Details
Closed on
Feb 27, 2001
Sold by
Vane Raymond and Vane Barbara
Bought by
Spencer Earle
Current Estimated Value
Home Financials for this Owner
Home Financials are based on the most recent Mortgage that was taken out on this home.
Original Mortgage
$126,063
Interest Rate
6.89%
Purchase Details
Closed on
Mar 31, 1987
Sold by
Nelson Marguerite
Bought by
Vane Raymond
Create a Home Valuation Report for This Property
The Home Valuation Report is an in-depth analysis detailing your home's value as well as a comparison with similar homes in the area
Home Values in the Area
Average Home Value in this Area
Purchase History
| Date | Buyer | Sale Price | Title Company |
|---|---|---|---|
| Spencer Earle | $128,100 | -- | |
| Vane Raymond | $117,500 | -- |
Source: Public Records
Mortgage History
| Date | Status | Borrower | Loan Amount |
|---|---|---|---|
| Open | Vane Raymond | $195,300 | |
| Closed | Vane Raymond | $45,000 | |
| Closed | Vane Raymond | $127,600 | |
| Closed | Vane Raymond | $126,063 |
Source: Public Records
Tax History
| Year | Tax Paid | Tax Assessment Tax Assessment Total Assessment is a certain percentage of the fair market value that is determined by local assessors to be the total taxable value of land and additions on the property. | Land | Improvement |
|---|---|---|---|---|
| 2025 | $6,123 | $175,000 | $56,600 | $118,400 |
| 2024 | $5,959 | $175,000 | $56,600 | $118,400 |
| 2023 | $5,915 | $175,000 | $56,600 | $118,400 |
| 2022 | $5,371 | $175,000 | $56,600 | $118,400 |
| 2021 | $5,041 | $134,330 | $46,890 | $87,440 |
| 2020 | $5,041 | $134,330 | $46,890 | $87,440 |
| 2019 | $5,055 | $134,330 | $46,890 | $87,440 |
| 2018 | $4,970 | $134,330 | $46,890 | $87,440 |
| 2017 | $4,692 | $134,330 | $46,890 | $87,440 |
| 2016 | $4,584 | $133,600 | $48,110 | $85,490 |
| 2015 | $4,441 | $133,600 | $48,110 | $85,490 |
| 2014 | $4,326 | $133,600 | $48,110 | $85,490 |
Source: Public Records
Map
Nearby Homes
Your Personal Tour Guide
Ask me questions while you tour the home.