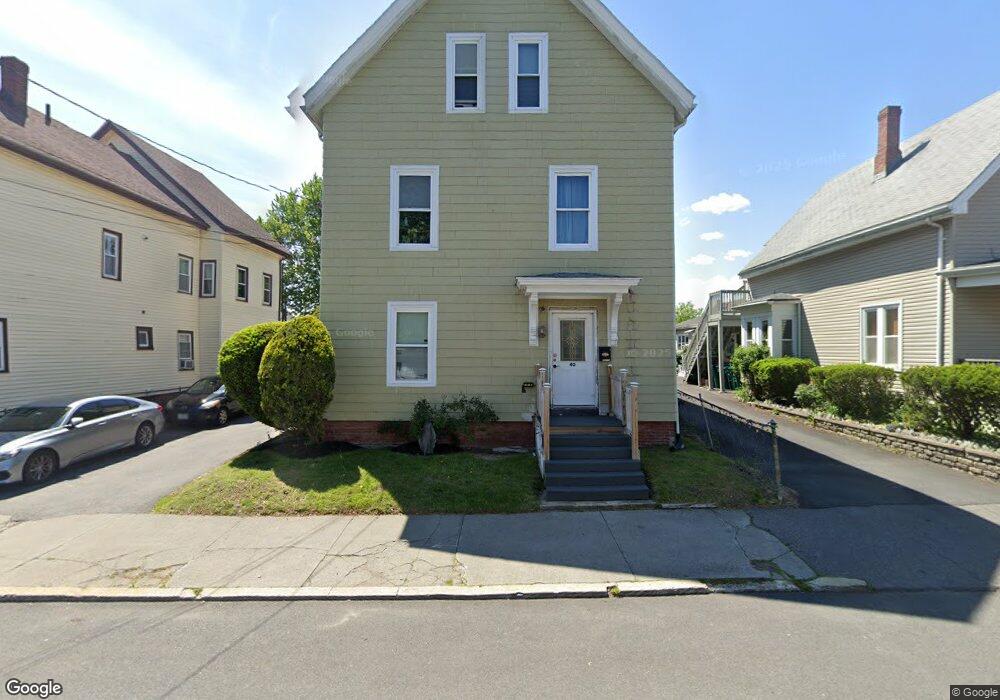
40 Cedar St Lynn, MA 01905
Pine Hill NeighborhoodEstimated Value: $666,000 - $895,000
8
Beds
3
Baths
2,941
Sq Ft
$271/Sq Ft
Est. Value
About This Home
This home is located at 40 Cedar St, Lynn, MA 01905 and is currently estimated at $796,889, approximately $270 per square foot. 40 Cedar St is a home located in Essex County with nearby schools including Tracy Elementary School, William R. Fallon School, and Fecteau-Leary Junior/Senior High School.
Ownership History
Date
Name
Owned For
Owner Type
Purchase Details
Closed on
May 25, 1994
Sold by
Amirault Joseph and Amirault Paul
Bought by
Myette Richard F and Myette Joan
Current Estimated Value
Home Financials for this Owner
Home Financials are based on the most recent Mortgage that was taken out on this home.
Original Mortgage
$86,450
Interest Rate
8.22%
Mortgage Type
Purchase Money Mortgage
Create a Home Valuation Report for This Property
The Home Valuation Report is an in-depth analysis detailing your home's value as well as a comparison with similar homes in the area
Home Values in the Area
Average Home Value in this Area
Purchase History
| Date | Buyer | Sale Price | Title Company |
|---|---|---|---|
| Myette Richard F | $93,000 | -- |
Source: Public Records
Mortgage History
| Date | Status | Borrower | Loan Amount |
|---|---|---|---|
| Closed | Myette Richard F | $86,450 |
Source: Public Records
Tax History
| Year | Tax Paid | Tax Assessment Tax Assessment Total Assessment is a certain percentage of the fair market value that is determined by local assessors to be the total taxable value of land and additions on the property. | Land | Improvement |
|---|---|---|---|---|
| 2025 | $7,917 | $764,207 | $208,300 | $555,907 |
| 2024 | $7,477 | $710,100 | $195,700 | $514,400 |
| 2023 | $7,446 | $667,800 | $189,700 | $478,100 |
| 2022 | $7,690 | $618,700 | $175,700 | $443,000 |
| 2021 | $7,336 | $563,000 | $168,700 | $394,300 |
| 2020 | $6,688 | $499,100 | $148,700 | $350,400 |
| 2019 | $6,232 | $435,800 | $121,600 | $314,200 |
| 2018 | $5,537 | $365,500 | $101,100 | $264,400 |
| 2017 | $5,429 | $348,000 | $85,700 | $262,300 |
| 2016 | $4,975 | $307,500 | $76,400 | $231,100 |
| 2015 | $4,620 | $275,800 | $71,300 | $204,500 |
Source: Public Records
Map
Nearby Homes
- 34 Grove St
- 16 Salem St
- 274 Boston St
- 99 New Park St
- 50-50A Kirtland St
- 66 Harwood St
- 136 Franklin St
- 78-80 Spencer St
- 43 Baker St
- 73 Waterhill St
- 99 Franklin St
- 20 Murray St
- 70 Wyman St
- 81A Franklin St
- 121 Johnson St Unit 3L
- 28 Wyman St
- 46 Wilfred St
- 1 Hillcrest Ave
- 51 Laighton St Unit 7
- 45 Henry Ave
Your Personal Tour Guide
Ask me questions while you tour the home.