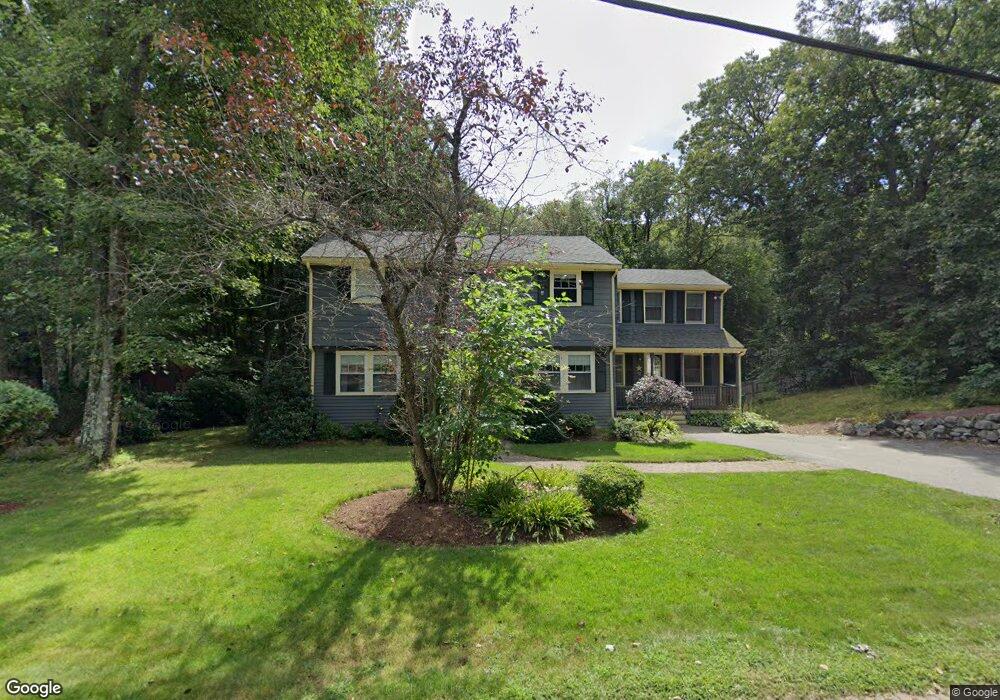
40 Chandler Rd Burlington, MA 01803
North Burlington NeighborhoodEstimated Value: $840,000 - $1,018,000
5
Beds
3
Baths
2,336
Sq Ft
$390/Sq Ft
Est. Value
About This Home
This home is located at 40 Chandler Rd, Burlington, MA 01803 and is currently estimated at $911,482, approximately $390 per square foot. 40 Chandler Rd is a home located in Middlesex County with nearby schools including Burlington High School, Fox Hill, and Marshall Simonds Middle School.
Ownership History
Date
Name
Owned For
Owner Type
Purchase Details
Closed on
Mar 14, 2014
Sold by
Sheridan James P and Sheridan Kathleen M
Bought by
Sheridan Ft and Sheridan
Current Estimated Value
Purchase Details
Closed on
Aug 31, 1995
Sold by
Mundie William R and Mundie Betty L
Bought by
Sheridan James P and Sheridan Kathleen M
Create a Home Valuation Report for This Property
The Home Valuation Report is an in-depth analysis detailing your home's value as well as a comparison with similar homes in the area
Home Values in the Area
Average Home Value in this Area
Purchase History
| Date | Buyer | Sale Price | Title Company |
|---|---|---|---|
| Sheridan Ft | -- | -- | |
| Sheridan James P | $189,500 | -- |
Source: Public Records
Mortgage History
| Date | Status | Borrower | Loan Amount |
|---|---|---|---|
| Previous Owner | Sheridan James P | $202,000 | |
| Previous Owner | Sheridan James P | $205,100 | |
| Previous Owner | Sheridan James P | $225,000 |
Source: Public Records
Tax History Compared to Growth
Tax History
| Year | Tax Paid | Tax Assessment Tax Assessment Total Assessment is a certain percentage of the fair market value that is determined by local assessors to be the total taxable value of land and additions on the property. | Land | Improvement |
|---|---|---|---|---|
| 2025 | $6,932 | $800,500 | $437,200 | $363,300 |
| 2024 | $6,565 | $734,300 | $399,200 | $335,100 |
| 2023 | $6,333 | $673,700 | $346,000 | $327,700 |
| 2022 | $6,146 | $617,700 | $314,700 | $303,000 |
| 2021 | $5,995 | $602,500 | $299,500 | $303,000 |
| 2020 | $5,887 | $610,700 | $294,700 | $316,000 |
| 2019 | $5,748 | $548,500 | $275,700 | $272,800 |
| 2018 | $5,702 | $536,900 | $275,700 | $261,200 |
| 2017 | $5,538 | $536,900 | $275,700 | $261,200 |
| 2016 | $5,495 | $479,500 | $237,700 | $241,800 |
| 2015 | $5,442 | $479,500 | $237,700 | $241,800 |
| 2014 | $5,148 | $429,000 | $205,400 | $223,600 |
Source: Public Records
Map
Nearby Homes
- 86 Drake Rd
- 38 Freeport Dr
- 220 Mill St
- 28 Hart St
- 7 Maple St
- 112 Pearl St Unit B
- 8 Laurie Ln
- 137 Winn St
- 10 Murray Ave Unit 15
- 94 Center St
- 6 Arthur Woods Ave
- 129 Cambridge St Unit 1
- 908 Main St
- 29 Beaverbrook Rd
- 17 Sunnyside Rd
- 35 Phillip Ave
- 6 Tidd Ave
- 26 E Dexter Ave
- 12 Maple Ridge Dr
- 29 Grove Ln Unit 29