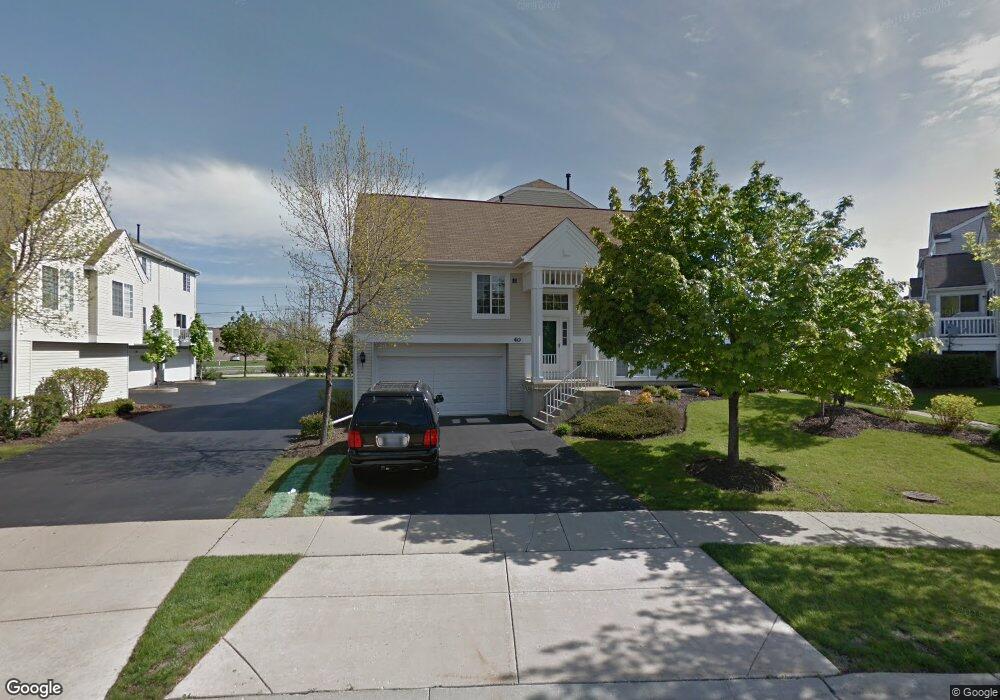
40 Cherbourg Ct Unit 491713 Wheeling, IL 60090
Estimated Value: $344,000 - $385,000
3
Beds
--
Bath
240,177
Sq Ft
$2/Sq Ft
Est. Value
About This Home
This home is located at 40 Cherbourg Ct Unit 491713, Wheeling, IL 60090 and is currently estimated at $361,292, approximately $1 per square foot. 40 Cherbourg Ct Unit 491713 is a home located in Cook County with nearby schools including Frost Elementary School, Oliver W Holmes Middle School, and Wheeling High School.
Ownership History
Date
Name
Owned For
Owner Type
Purchase Details
Closed on
Jun 24, 2005
Sold by
Kukla Ronald E and Kukla Ljiljana
Bought by
Kukla Ronald E
Current Estimated Value
Purchase Details
Closed on
May 22, 2003
Sold by
Kukla Ronald E and Kukla Ljiljana
Bought by
Kukla Ronald E and Kukla Ljiljana
Home Financials for this Owner
Home Financials are based on the most recent Mortgage that was taken out on this home.
Original Mortgage
$199,000
Outstanding Balance
$79,915
Interest Rate
4.75%
Mortgage Type
Unknown
Estimated Equity
$281,377
Purchase Details
Closed on
Oct 29, 1998
Sold by
Avalon Sienna Llc
Bought by
Kukla Ronald E and Kukla Ljiljana
Home Financials for this Owner
Home Financials are based on the most recent Mortgage that was taken out on this home.
Original Mortgage
$190,600
Interest Rate
11.5%
Create a Home Valuation Report for This Property
The Home Valuation Report is an in-depth analysis detailing your home's value as well as a comparison with similar homes in the area
Home Values in the Area
Average Home Value in this Area
Purchase History
| Date | Buyer | Sale Price | Title Company |
|---|---|---|---|
| Kukla Ronald E | -- | Git | |
| Kukla Ronald E | -- | Lawyers Title Ins Corp | |
| Kukla Ronald E | -- | Lawyers Title Ins Corp | |
| Kukla Ronald E | $212,000 | Ticor Title |
Source: Public Records
Mortgage History
| Date | Status | Borrower | Loan Amount |
|---|---|---|---|
| Open | Kukla Ronald E | $199,000 | |
| Closed | Kukla Ronald E | $199,000 | |
| Previous Owner | Kukla Ronald E | $190,600 |
Source: Public Records
Tax History Compared to Growth
Tax History
| Year | Tax Paid | Tax Assessment Tax Assessment Total Assessment is a certain percentage of the fair market value that is determined by local assessors to be the total taxable value of land and additions on the property. | Land | Improvement |
|---|---|---|---|---|
| 2024 | $8,471 | $28,424 | $7,325 | $21,099 |
| 2023 | $8,044 | $28,424 | $7,325 | $21,099 |
| 2022 | $8,044 | $28,424 | $7,325 | $21,099 |
| 2021 | $8,002 | $24,776 | $610 | $24,166 |
| 2020 | $7,869 | $24,776 | $610 | $24,166 |
| 2019 | $8,026 | $27,751 | $610 | $27,141 |
| 2018 | $6,392 | $20,840 | $488 | $20,352 |
| 2017 | $6,278 | $20,840 | $488 | $20,352 |
| 2016 | $6,155 | $20,840 | $488 | $20,352 |
| 2015 | $5,668 | $18,427 | $2,808 | $15,619 |
| 2014 | $5,995 | $19,726 | $2,808 | $16,918 |
| 2013 | $5,530 | $19,726 | $2,808 | $16,918 |
Source: Public Records
Map
Nearby Homes
- 42 Cherbourg Ct Unit 492714
- 70 Cherbourg Ct Unit 70
- 1655 Geneva Dr Unit 43714
- 150 Lucerne Ct Unit 51713
- 1719 Sienna Ct Unit 242714
- 161 Lucerne Ct Unit 111713
- 674 Pinecrest Dr Unit 203
- 1575 Sandpebble Dr Unit 226
- 1575 Sandpebble Dr Unit 336
- 1425 Sandpebble Dr Unit 340
- 203 Coldren Dr
- 1550 Sandpebble Dr Unit 307
- 1550 Sandpebble Dr Unit 209
- 18 E Old Willow Rd Unit 106N
- 16 E Old Willow Rd Unit 202S
- 16 E Old Willow Rd Unit 405S
- 16 E Old Willow Rd Unit 424S
- 1450 Sandpebble Dr Unit 333
- 1450 Sandpebble Dr Unit 227
- 1430 Sandstone Dr Unit 202
- 44 Cherbourg Ct Unit 493714
- 46 Cherbourg Ct Unit 494714
- 30 Cherbourg Ct Unit 504713
- 32 Cherbourg Ct Unit 503714
- 50 Cherbourg Ct Unit 484713
- 34 Cherbourg Ct Unit 502714
- 36 Cherbourg Ct Unit 501714
- 52 Cherbourg Ct Unit 483714
- 54 Cherbourg Ct Unit 482714
- 63 Cherbourg Ct Unit 412714
- 56 Cherbourg Ct Unit 481714
- 61 Cherbourg Ct Unit 411713
- 65 Cherbourg Ct Unit 413714
- 60 Cherbourg Ct Unit 471713
- 22 Cherbourg Ct Unit 512714
- 20 Cherbourg Ct Unit 511713
- 24 Cherbourg Ct Unit 513714
- 26 Cherbourg Ct Unit 514714
- 62 Cherbourg Ct Unit 472714
- 67 Cherbourg Ct Unit 414713