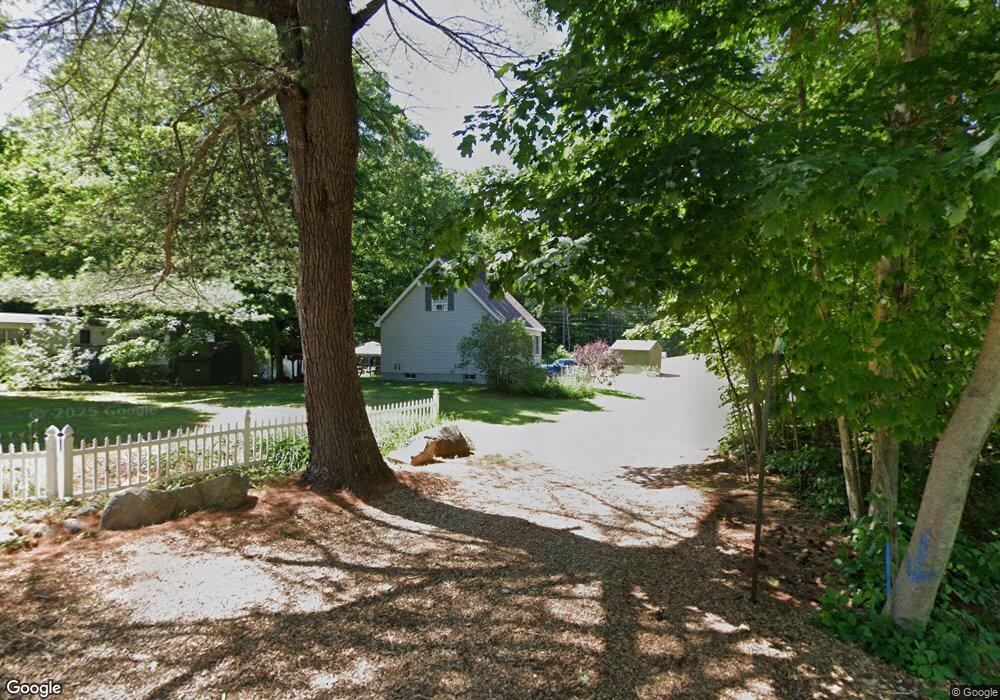
40 Conway St Sabattus, ME 04280
Estimated Value: $262,000 - $371,038
2
Beds
1
Bath
624
Sq Ft
$510/Sq Ft
Est. Value
About This Home
This home is located at 40 Conway St, Sabattus, ME 04280 and is currently estimated at $318,510, approximately $510 per square foot. 40 Conway St is a home located in Androscoggin County with nearby schools including Carrie Ricker School, Oak Hill Middle School, and Oak Hill High School.
Ownership History
Date
Name
Owned For
Owner Type
Purchase Details
Closed on
Jun 14, 2016
Sold by
Harrington James M and Harrington Rosemary A
Bought by
Fournier David E and Fournier Darling D
Current Estimated Value
Purchase Details
Closed on
Apr 25, 2006
Sold by
Beaudoin Lee J and Beaudoin Paul J
Bought by
Harrington James M and Harrington Rosemary A
Home Financials for this Owner
Home Financials are based on the most recent Mortgage that was taken out on this home.
Original Mortgage
$164,000
Interest Rate
6.37%
Mortgage Type
Purchase Money Mortgage
Create a Home Valuation Report for This Property
The Home Valuation Report is an in-depth analysis detailing your home's value as well as a comparison with similar homes in the area
Home Values in the Area
Average Home Value in this Area
Purchase History
| Date | Buyer | Sale Price | Title Company |
|---|---|---|---|
| Fournier David E | -- | -- | |
| Harrington James M | -- | -- |
Source: Public Records
Mortgage History
| Date | Status | Borrower | Loan Amount |
|---|---|---|---|
| Previous Owner | Harrington James M | $164,000 | |
| Previous Owner | Harrington James M | $30,750 |
Source: Public Records
Tax History
| Year | Tax Paid | Tax Assessment Tax Assessment Total Assessment is a certain percentage of the fair market value that is determined by local assessors to be the total taxable value of land and additions on the property. | Land | Improvement |
|---|---|---|---|---|
| 2024 | $3,327 | $174,200 | $111,500 | $62,700 |
| 2023 | $3,179 | $174,200 | $111,500 | $62,700 |
| 2022 | $2,900 | $174,200 | $111,500 | $62,700 |
| 2021 | $2,735 | $174,200 | $111,500 | $62,700 |
| 2020 | $3,459 | $194,900 | $133,800 | $61,100 |
| 2019 | $3,426 | $193,000 | $133,800 | $59,200 |
| 2018 | $3,426 | $193,000 | $133,800 | $59,200 |
| 2017 | $3,426 | $193,000 | $133,800 | $59,200 |
| 2016 | $3,619 | $193,000 | $133,800 | $59,200 |
| 2014 | $3,435 | $193,000 | $133,800 | $59,200 |
| 2013 | $3,156 | $193,000 | $133,800 | $59,200 |
Source: Public Records
Map
Nearby Homes
Your Personal Tour Guide
Ask me questions while you tour the home.