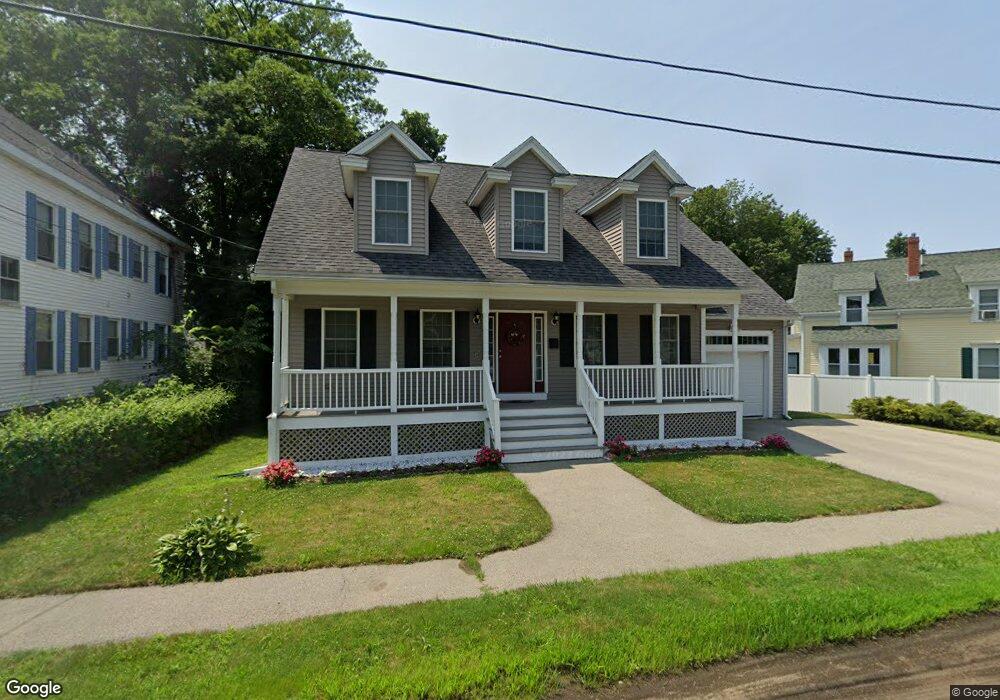
40 Crescent St Haverhill, MA 01835
Central Bradford NeighborhoodEstimated Value: $604,000 - $631,000
3
Beds
2
Baths
1,800
Sq Ft
$345/Sq Ft
Est. Value
About This Home
This home is located at 40 Crescent St, Haverhill, MA 01835 and is currently estimated at $621,368, approximately $345 per square foot. 40 Crescent St is a home located in Essex County with nearby schools including Greenleaf Academy, Bradford Elementary School, and Sacred Heart School.
Ownership History
Date
Name
Owned For
Owner Type
Purchase Details
Closed on
Mar 21, 2011
Sold by
Bradford Unlimited Cor
Bought by
Antonovici Constantin M and Antonovici Dorina D
Current Estimated Value
Home Financials for this Owner
Home Financials are based on the most recent Mortgage that was taken out on this home.
Original Mortgage
$287,850
Interest Rate
5.12%
Mortgage Type
FHA
Create a Home Valuation Report for This Property
The Home Valuation Report is an in-depth analysis detailing your home's value as well as a comparison with similar homes in the area
Home Values in the Area
Average Home Value in this Area
Purchase History
| Date | Buyer | Sale Price | Title Company |
|---|---|---|---|
| Antonovici Constantin M | $305,000 | -- |
Source: Public Records
Mortgage History
| Date | Status | Borrower | Loan Amount |
|---|---|---|---|
| Open | Antonovici Constantin M | $279,800 | |
| Closed | Antonovici Constantin M | $287,850 |
Source: Public Records
Tax History Compared to Growth
Tax History
| Year | Tax Paid | Tax Assessment Tax Assessment Total Assessment is a certain percentage of the fair market value that is determined by local assessors to be the total taxable value of land and additions on the property. | Land | Improvement |
|---|---|---|---|---|
| 2025 | $5,763 | $538,100 | $185,600 | $352,500 |
| 2024 | $5,600 | $526,300 | $185,600 | $340,700 |
| 2023 | $5,309 | $476,100 | $174,800 | $301,300 |
| 2022 | $5,265 | $413,900 | $167,100 | $246,800 |
| 2021 | $5,102 | $379,600 | $153,200 | $226,400 |
| 2020 | $5,099 | $374,900 | $148,500 | $226,400 |
| 2019 | $5,230 | $374,900 | $148,500 | $226,400 |
| 2018 | $5,054 | $354,400 | $142,300 | $212,100 |
| 2017 | $4,848 | $323,400 | $123,800 | $199,600 |
| 2016 | $4,809 | $313,100 | $117,600 | $195,500 |
| 2015 | $4,616 | $300,700 | $105,200 | $195,500 |
Source: Public Records
Map
Nearby Homes
- 399 S Main St
- 28 Fernwood Ave
- 72 River St Unit 7
- 72 River St Unit 10
- 72 River St Unit 6
- 72 River St Unit 3
- 219 River St
- 41 S Lincoln St
- 552 S Main St Unit 2
- 27 S Elm St Unit 2
- 21 Conover Way
- 211 S Main St
- 335 Washington St Unit 335
- 15 Fermanagh St
- 2 Washington St
- 2 Washington St Unit 201
- 52-58 Washington St Unit BC
- 80 Wingate St Unit 4C
- 80 Wingate St Unit 2F
- 8 Victoria Ct
- 34 Crescent St Unit 36
- 42 Blossom St
- 42 Blossom St Unit 42
- 42 Blossom St
- 44 Blossom St
- 44 Blossom St Unit 44
- 44 Blossom St
- 32 Crescent St
- 24 Vernon St
- 28 Vernon St
- 37 Blossom St
- 41 Blossom St Unit 43
- 48 Blossom St
- 48 Blossom St Unit 50
- 48-50 Blossom St
- 28 Crescent St
- 45 Blossom St Unit 47
- 30 Vernon St
- 30 Blossom St
- 26 Crescent St