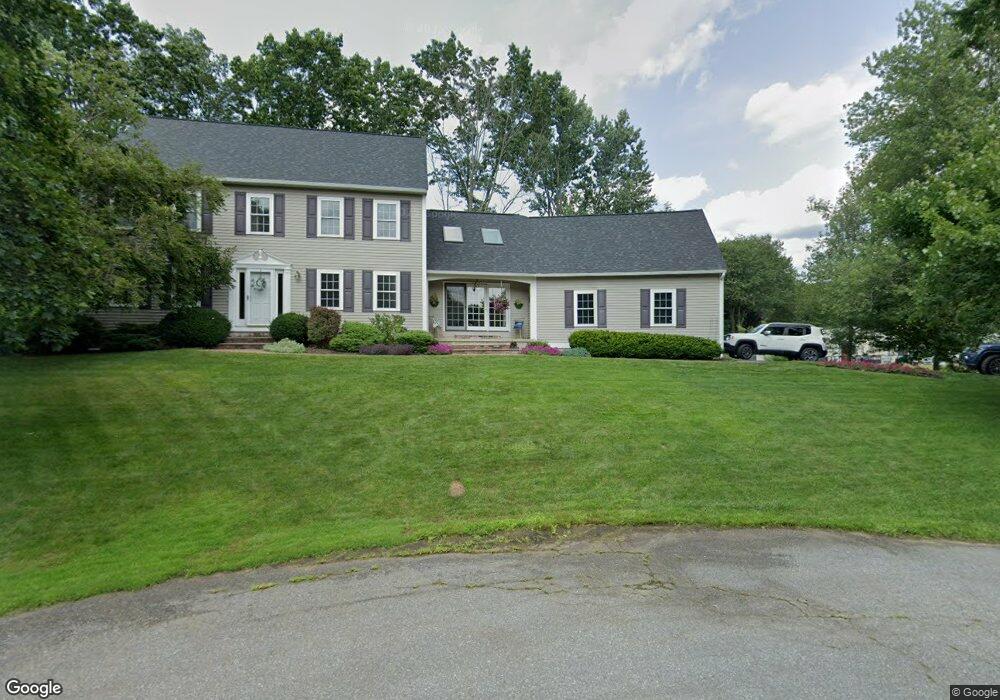
40 Dandridge Ave Salem, NH 03079
Depot Village NeighborhoodEstimated Value: $707,534 - $828,000
3
Beds
3
Baths
2,646
Sq Ft
$289/Sq Ft
Est. Value
About This Home
This home is located at 40 Dandridge Ave, Salem, NH 03079 and is currently estimated at $763,384, approximately $288 per square foot. 40 Dandridge Ave is a home located in Rockingham County with nearby schools including William E. Lancaster School, Woodbury School, and Salem High School.
Ownership History
Date
Name
Owned For
Owner Type
Purchase Details
Closed on
Jul 27, 2023
Sold by
Carpenito Jane V and Carpenito James W
Bought by
Carpenito Jane V and Carpenito James W
Current Estimated Value
Purchase Details
Closed on
Mar 29, 2018
Sold by
Carpenito Jane V
Bought by
Carpenito Jane V and Carpenito James W
Purchase Details
Closed on
Aug 9, 1999
Sold by
Czekanski John A and Czekanski Norinne R
Bought by
Carpenito Jane V
Home Financials for this Owner
Home Financials are based on the most recent Mortgage that was taken out on this home.
Original Mortgage
$160,000
Interest Rate
7.54%
Mortgage Type
Purchase Money Mortgage
Create a Home Valuation Report for This Property
The Home Valuation Report is an in-depth analysis detailing your home's value as well as a comparison with similar homes in the area
Home Values in the Area
Average Home Value in this Area
Purchase History
| Date | Buyer | Sale Price | Title Company |
|---|---|---|---|
| Carpenito Jane V | -- | None Available | |
| Carpenito Jane V | -- | -- | |
| Carpenito Jane V | -- | -- | |
| Carpenito Jane V | $250,000 | -- | |
| Carpenito Jane V | $250,000 | -- |
Source: Public Records
Mortgage History
| Date | Status | Borrower | Loan Amount |
|---|---|---|---|
| Previous Owner | Carpenito Jane V | $338,958 | |
| Previous Owner | Carpenito Jane V | $268,600 | |
| Previous Owner | Carpenito Jane V | $160,000 |
Source: Public Records
Tax History Compared to Growth
Tax History
| Year | Tax Paid | Tax Assessment Tax Assessment Total Assessment is a certain percentage of the fair market value that is determined by local assessors to be the total taxable value of land and additions on the property. | Land | Improvement |
|---|---|---|---|---|
| 2024 | $10,020 | $569,300 | $191,100 | $378,200 |
| 2023 | $9,655 | $569,300 | $191,100 | $378,200 |
| 2022 | $9,137 | $569,300 | $191,100 | $378,200 |
| 2021 | $9,097 | $569,300 | $191,100 | $378,200 |
| 2020 | $8,960 | $406,900 | $136,500 | $270,400 |
| 2019 | $8,944 | $406,900 | $136,500 | $270,400 |
| 2018 | $8,793 | $406,900 | $136,500 | $270,400 |
| 2017 | $8,480 | $406,900 | $136,500 | $270,400 |
| 2016 | $8,313 | $406,900 | $136,500 | $270,400 |
| 2015 | $7,534 | $352,200 | $135,600 | $216,600 |
| 2014 | $7,322 | $352,200 | $135,600 | $216,600 |
| 2013 | $7,206 | $352,200 | $135,600 | $216,600 |
Source: Public Records
Map
Nearby Homes