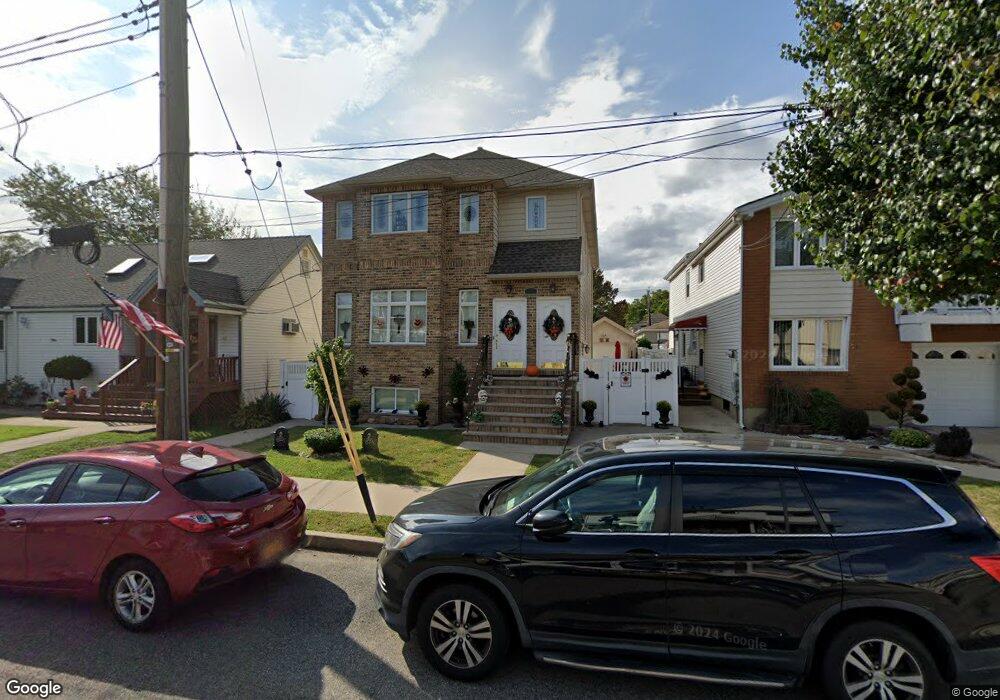
40 Dickie Ave Staten Island, NY 10314
Westerleigh NeighborhoodEstimated Value: $1,062,000 - $1,304,405
6
Beds
6
Baths
2,600
Sq Ft
$459/Sq Ft
Est. Value
About This Home
This home is located at 40 Dickie Ave, Staten Island, NY 10314 and is currently estimated at $1,193,851, approximately $459 per square foot. 40 Dickie Ave is a home located in Richmond County with nearby schools including P.S. 30 Westerleigh, I.S. 51 Edwin Markham, and Port Richmond High School.
Ownership History
Date
Name
Owned For
Owner Type
Purchase Details
Closed on
Apr 13, 2019
Sold by
Desimone Geraldine
Bought by
Desimone Steven
Current Estimated Value
Purchase Details
Closed on
Oct 13, 2014
Sold by
Pannell Edward
Bought by
Desimone Geraldine
Purchase Details
Closed on
Dec 2, 2011
Sold by
Village Development Corp Of S I Inc
Bought by
Pannell Edeward and Desimone Geraldine
Home Financials for this Owner
Home Financials are based on the most recent Mortgage that was taken out on this home.
Original Mortgage
$190,000
Interest Rate
4.09%
Mortgage Type
New Conventional
Purchase Details
Closed on
Oct 29, 2010
Sold by
Depaola Theresa
Bought by
Village Development Corp Of S I Inc
Home Financials for this Owner
Home Financials are based on the most recent Mortgage that was taken out on this home.
Original Mortgage
$165,000
Interest Rate
4%
Mortgage Type
Seller Take Back
Create a Home Valuation Report for This Property
The Home Valuation Report is an in-depth analysis detailing your home's value as well as a comparison with similar homes in the area
Home Values in the Area
Average Home Value in this Area
Purchase History
| Date | Buyer | Sale Price | Title Company |
|---|---|---|---|
| Desimone Steven | -- | None Available | |
| Desimone Geraldine | -- | The Judicial Title Insurance | |
| Pannell Edeward | $702,592 | Fidelity Natl Title Ins Co | |
| Village Development Corp Of S I Inc | $215,000 | New Jersey Title Ins Co |
Source: Public Records
Mortgage History
| Date | Status | Borrower | Loan Amount |
|---|---|---|---|
| Previous Owner | Pannell Edeward | $190,000 | |
| Previous Owner | Village Development Corp Of S I Inc | $165,000 |
Source: Public Records
Tax History Compared to Growth
Tax History
| Year | Tax Paid | Tax Assessment Tax Assessment Total Assessment is a certain percentage of the fair market value that is determined by local assessors to be the total taxable value of land and additions on the property. | Land | Improvement |
|---|---|---|---|---|
| 2025 | $11,176 | $67,740 | $11,702 | $56,038 |
| 2024 | $11,176 | $63,840 | $11,714 | $52,126 |
| 2023 | $10,684 | $52,607 | $10,080 | $42,527 |
| 2022 | $9,908 | $62,100 | $13,440 | $48,660 |
| 2021 | $10,445 | $57,300 | $13,440 | $43,860 |
| 2020 | $10,404 | $56,520 | $13,440 | $43,080 |
| 2019 | $9,700 | $54,780 | $13,440 | $41,340 |
| 2018 | $8,937 | $43,839 | $10,514 | $33,325 |
| 2017 | $8,431 | $41,358 | $12,031 | $29,327 |
| 2016 | $8,268 | $41,358 | $11,480 | $29,878 |
| 2015 | $7,415 | $40,958 | $11,503 | $29,455 |
| 2014 | $7,415 | $38,640 | $11,880 | $26,760 |
Source: Public Records
Map
Nearby Homes
- 46 Dickie Ave
- 28 Dickie Ave
- 65 Livermore Ave
- 69 Livermore Ave
- 61 Livermore Ave
- 50 Dickie Ave
- 24 Dickie Ave
- 73 Livermore Ave
- 57 Livermore Ave
- 33 Dickie Ave
- 41 Dickie Ave
- 53 Livermore Ave
- 53 Livermore Ave Unit 2
- 77 Livermore Ave
- 31 Dickie Ave
- 20 Dickie Ave
- 27 Dickie Ave
- 47 Dickie Ave
- 49 Livermore Ave
- 23 Dickie Ave