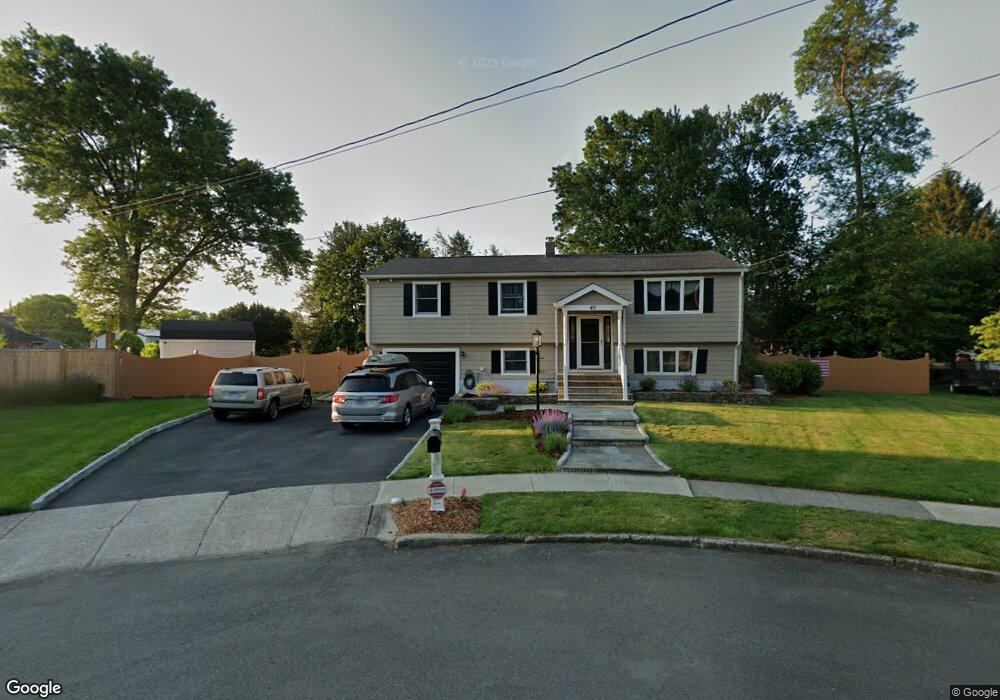
40 Downs Way Milford, CT 06460
East Milford NeighborhoodEstimated Value: $527,000 - $695,000
3
Beds
3
Baths
1,902
Sq Ft
$323/Sq Ft
Est. Value
About This Home
This home is located at 40 Downs Way, Milford, CT 06460 and is currently estimated at $615,059, approximately $323 per square foot. 40 Downs Way is a home located in New Haven County with nearby schools including Live Oaks School, East Shore Middle School, and Joseph A. Foran High School.
Ownership History
Date
Name
Owned For
Owner Type
Purchase Details
Closed on
Nov 20, 2020
Sold by
Warakomski Robert
Bought by
Warakomski Jennifer and Warakomski Robert
Current Estimated Value
Home Financials for this Owner
Home Financials are based on the most recent Mortgage that was taken out on this home.
Original Mortgage
$181,300
Interest Rate
2.7%
Mortgage Type
New Conventional
Purchase Details
Closed on
Sep 15, 1998
Sold by
Mannino Thomas A and Mannino Donna L
Bought by
Warakomski Robert
Purchase Details
Closed on
Jun 26, 1990
Sold by
Miller Jack E
Bought by
Mannino Thomas A
Purchase Details
Closed on
Sep 13, 1988
Sold by
Nelson Edith J
Bought by
Miller Jack E
Create a Home Valuation Report for This Property
The Home Valuation Report is an in-depth analysis detailing your home's value as well as a comparison with similar homes in the area
Home Values in the Area
Average Home Value in this Area
Purchase History
| Date | Buyer | Sale Price | Title Company |
|---|---|---|---|
| Warakomski Jennifer | -- | None Available | |
| Warakomski Jennifer | -- | None Available | |
| Warakomski Jennifer | -- | None Available | |
| Warakomski Robert | $192,000 | -- | |
| Warakomski Robert | $192,000 | -- | |
| Mannino Thomas A | $186,900 | -- | |
| Miller Jack E | $192,500 | -- |
Source: Public Records
Mortgage History
| Date | Status | Borrower | Loan Amount |
|---|---|---|---|
| Previous Owner | Warakomski Jennifer | $181,300 | |
| Previous Owner | Miller Jack E | $323,000 | |
| Previous Owner | Miller Jack E | $340,000 |
Source: Public Records
Tax History
| Year | Tax Paid | Tax Assessment Tax Assessment Total Assessment is a certain percentage of the fair market value that is determined by local assessors to be the total taxable value of land and additions on the property. | Land | Improvement |
|---|---|---|---|---|
| 2025 | $9,681 | $327,620 | $124,740 | $202,880 |
| 2024 | $9,547 | $327,620 | $124,740 | $202,880 |
| 2023 | $8,727 | $321,190 | $124,740 | $196,450 |
| 2022 | $8,560 | $321,190 | $124,740 | $196,450 |
| 2021 | $7,596 | $274,730 | $91,060 | $183,670 |
| 2020 | $7,605 | $274,730 | $91,060 | $183,670 |
| 2019 | $7,613 | $274,730 | $91,060 | $183,670 |
| 2018 | $7,621 | $274,730 | $91,060 | $183,670 |
| 2017 | $7,635 | $274,730 | $91,060 | $183,670 |
| 2016 | $7,928 | $284,760 | $91,060 | $193,700 |
| 2015 | $7,939 | $284,760 | $91,060 | $193,700 |
| 2014 | $7,751 | $284,760 | $91,060 | $193,700 |
Source: Public Records
Map
Nearby Homes
- 36 Kenwood Rd
- 22 Lynmoor St
- 21 Lyda Dr
- 216 Anderson Ave
- 2 Turtle Ln
- 330 Merwin Ave Unit 1D
- 29 Anderson Ave
- 11 Marble Ln
- 134 McQuillan Dr
- 46 Salem Walk
- 15 Brewster Rd
- 24 Anderson Ave
- 6 Howe St
- 83 Pauline Ave
- 1080 New Haven Ave Unit 113
- 1066 New Haven Ave Unit 41
- 71 Dalton Rd
- 29 Meetinghouse Ln
- 217 Merwin Ave
- 19 Kaye Rd
Your Personal Tour Guide
Ask me questions while you tour the home.