Estimated Value: $384,000 - $478,000
3
Beds
2
Baths
1,304
Sq Ft
$331/Sq Ft
Est. Value
About This Home
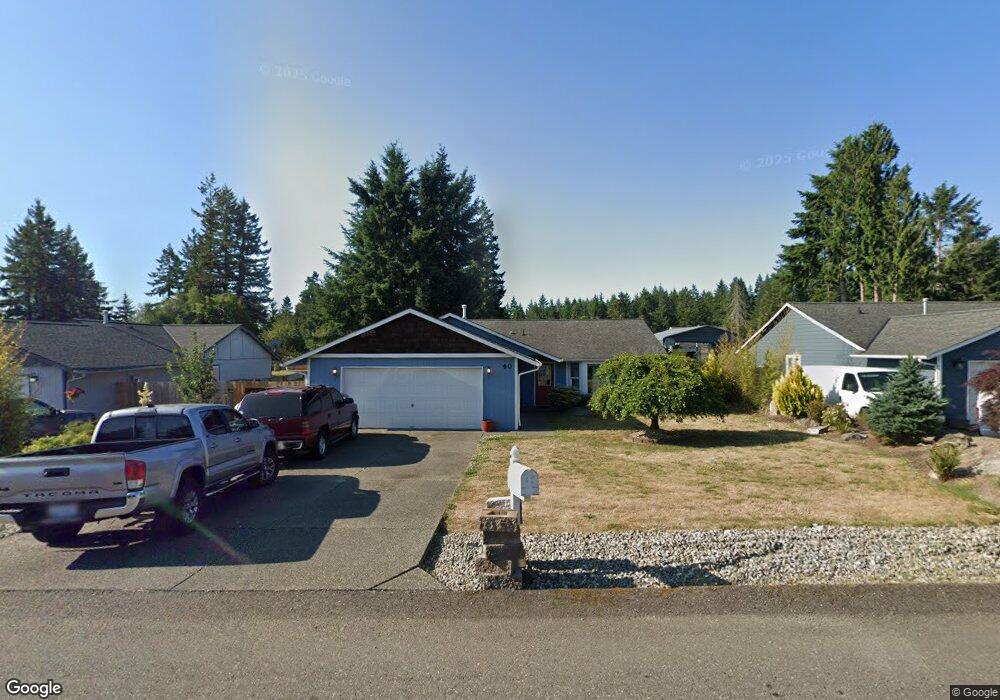
This home is located at 40 E Warbler Ct, Allyn, WA 98524 and is currently estimated at $431,185, approximately $330 per square foot. 40 E Warbler Ct is a home located in Mason County with nearby schools including North Mason Senior High School.
Ownership History
Date
Name
Owned For
Owner Type
Purchase Details
Closed on
Jul 8, 2015
Sold by
Tomas Paulina Gonzalez
Bought by
Marcos Juan A Gaspar
Current Estimated Value
Home Financials for this Owner
Home Financials are based on the most recent Mortgage that was taken out on this home.
Original Mortgage
$120,000
Outstanding Balance
$93,471
Interest Rate
3.83%
Mortgage Type
New Conventional
Estimated Equity
$337,714
Purchase Details
Closed on
Jun 8, 2015
Sold by
Nationstar Mortgage Llc
Bought by
Marcos Juan A Gaspar
Home Financials for this Owner
Home Financials are based on the most recent Mortgage that was taken out on this home.
Original Mortgage
$120,000
Outstanding Balance
$93,471
Interest Rate
3.83%
Mortgage Type
New Conventional
Estimated Equity
$337,714
Purchase Details
Closed on
Jan 7, 2015
Sold by
Ruddock Sally J
Bought by
Nationstar Mortgage Llc and Champion Mortgage Company
Purchase Details
Closed on
Dec 14, 2005
Sold by
Holcomb Raleigh M and Holcomb Bonnie A
Bought by
Ruddock Sally J
Create a Home Valuation Report for This Property
The Home Valuation Report is an in-depth analysis detailing your home's value as well as a comparison with similar homes in the area
Purchase History
| Date | Buyer | Sale Price | Title Company |
|---|---|---|---|
| Marcos Juan A Gaspar | -- | Mason County Title Ins Co | |
| Marcos Juan A Gaspar | $140,000 | Mason County Title Ins Co | |
| Nationstar Mortgage Llc | $153,753 | Mason County Title Ins Co | |
| Ruddock Sally J | $210,000 | Land Title Co |
Source: Public Records
Mortgage History
| Date | Status | Borrower | Loan Amount |
|---|---|---|---|
| Open | Marcos Juan A Gaspar | $120,000 |
Source: Public Records
Tax History
| Year | Tax Paid | Tax Assessment Tax Assessment Total Assessment is a certain percentage of the fair market value that is determined by local assessors to be the total taxable value of land and additions on the property. | Land | Improvement |
|---|---|---|---|---|
| 2025 | $2,861 | $360,885 | $40,255 | $320,630 |
| 2023 | $2,861 | $289,610 | $31,595 | $258,015 |
| 2022 | $2,760 | $305,690 | $30,860 | $274,830 |
| 2021 | $2,478 | $305,690 | $30,860 | $274,830 |
| 2020 | $2,533 | $285,170 | $28,055 | $257,115 |
| 2018 | $2,319 | $196,440 | $26,720 | $169,720 |
| 2017 | $2,103 | $196,590 | $26,870 | $169,720 |
| 2016 | $2,148 | $184,020 | $26,870 | $157,150 |
| 2015 | $1,841 | $188,595 | $36,920 | $151,675 |
| 2014 | -- | $183,895 | $33,800 | $150,095 |
| 2013 | -- | $188,995 | $46,800 | $142,195 |
Source: Public Records
Map
Nearby Homes
- 680 E State Route 302
- 920 E Old Ranch Rd Unit E1
- 0 Sterling Dr
- 400 Sterling Dr
- 19019 19013 E State Route 3
- 19019 Washington 3 Unit A
- 19019 Washington 3 Unit B
- 19017 E State Route 3 Unit A-B
- 19017 Washington 3 Unit A
- 19017 Washington 3 Unit B
- 671 E Old Ranch Rd
- 19015 E State Route 3 Unit B
- 19015 E State Route 3 Unit A-B
- 19015 E State Route 3 Unit A
- 181 E Rainier Ct
- 19013 Washington 3 Unit A-B
- 19013 Washington 3 Unit B
- 19013 Washington 3 Unit A
- 91 E Tepee Ln
- 19011 Washington 3 Unit A
- 30 E Warbler Ct
- 50 E Warbler Ct
- 60 E Warbler Ct
- 20 E Warbler Ct
- 0 E Cardinal Ct Unit 1306184
- 41 E Warbler Ct
- 40 E Swallow Ct
- 70 E Warbler Ct
- 40 E Swallow Ln
- 51 E Warbler Ct
- 21 E Warbler Ct
- 20 E Swallow Ln
- 20 E Swallow Ct
- 80 E Warbler Ct
- 40 Skylark Ct E
- 40 E Skylark Ct
- 51 E Cardinal Ct
- 1 E Belwood Ln
- 81 E Belwood Ln
- 71 E Warbler Ct
Your Personal Tour Guide
Ask me questions while you tour the home.