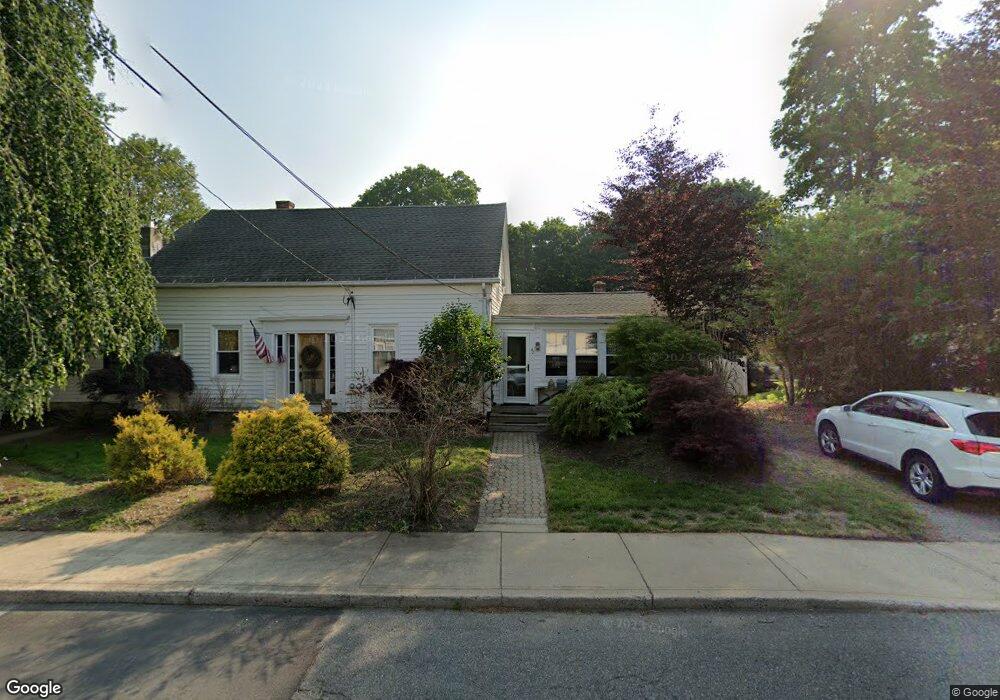
40 Elm St Uxbridge, MA 01569
Estimated Value: $588,681 - $674,000
4
Beds
3
Baths
2,322
Sq Ft
$270/Sq Ft
Est. Value
About This Home
This home is located at 40 Elm St, Uxbridge, MA 01569 and is currently estimated at $626,920, approximately $269 per square foot. 40 Elm St is a home located in Worcester County with nearby schools including Uxbridge High School, Our Lady of the Valley Regional School, and Whitinsville Christian School.
Ownership History
Date
Name
Owned For
Owner Type
Purchase Details
Closed on
Aug 22, 2014
Sold by
Beland Douglas D and Beland Amy
Bought by
Baldwin Joseph and Baldwin Justine
Current Estimated Value
Home Financials for this Owner
Home Financials are based on the most recent Mortgage that was taken out on this home.
Original Mortgage
$289,987
Outstanding Balance
$218,458
Interest Rate
3.87%
Mortgage Type
FHA
Estimated Equity
$408,462
Purchase Details
Closed on
Mar 31, 2006
Sold by
Beland Gail J and Beland Robert A
Bought by
Beland Douglas D
Home Financials for this Owner
Home Financials are based on the most recent Mortgage that was taken out on this home.
Original Mortgage
$320,000
Interest Rate
6.32%
Mortgage Type
Purchase Money Mortgage
Purchase Details
Closed on
Oct 12, 2005
Sold by
Beland Gail J and Beland Robert A
Bought by
Beland Douglas D
Create a Home Valuation Report for This Property
The Home Valuation Report is an in-depth analysis detailing your home's value as well as a comparison with similar homes in the area
Home Values in the Area
Average Home Value in this Area
Purchase History
| Date | Buyer | Sale Price | Title Company |
|---|---|---|---|
| Baldwin Joseph | $300,000 | -- | |
| Beland Douglas D | -- | -- | |
| Beland Douglas D | -- | -- | |
| Beland Douglas D | -- | -- | |
| Beland Douglas D | $350,000 | -- | |
| Beland Douglas D | $350,000 | -- | |
| Beland Douglas D | $350,000 | -- |
Source: Public Records
Mortgage History
| Date | Status | Borrower | Loan Amount |
|---|---|---|---|
| Open | Baldwin Joseph | $289,987 | |
| Closed | Baldwin Joseph | $289,987 | |
| Previous Owner | Beland Douglas D | $320,000 |
Source: Public Records
Tax History Compared to Growth
Tax History
| Year | Tax Paid | Tax Assessment Tax Assessment Total Assessment is a certain percentage of the fair market value that is determined by local assessors to be the total taxable value of land and additions on the property. | Land | Improvement |
|---|---|---|---|---|
| 2025 | $67 | $511,700 | $135,000 | $376,700 |
| 2024 | $5,543 | $429,000 | $123,800 | $305,200 |
| 2023 | $5,263 | $377,300 | $112,500 | $264,800 |
| 2022 | $4,951 | $326,600 | $102,000 | $224,600 |
| 2021 | $4,846 | $306,300 | $97,500 | $208,800 |
| 2020 | $4,779 | $285,500 | $100,100 | $185,400 |
| 2019 | $4,756 | $274,100 | $92,700 | $181,400 |
| 2018 | $4,303 | $250,600 | $92,700 | $157,900 |
| 2017 | $4,432 | $261,300 | $86,600 | $174,700 |
| 2016 | $4,359 | $248,100 | $85,000 | $163,100 |
| 2015 | $3,988 | $229,200 | $85,000 | $144,200 |
Source: Public Records
Map
Nearby Homes
- 36 Elm St
- 307 N Main St
- 113 Rogerson Crossing Unit 113
- 129 Elm St Unit Lot 7
- 3 Strathmore Shire Unit A
- 0 Homestead Ave
- 48 Homeward Ave
- 72 Homeward Ave
- 7 Jefferson Ct Unit 7
- 35 Highland Park Unit 35
- 50 Carrington Ln
- 235 Rivulet St
- 75 Lake St
- 60 Tyler Dr
- 94 Heritage Dr Unit 94
- 99 Country Club Dr
- 0 Louis St
- 44 Arthur Dr Unit 44
- 20 Nature View Dr Unit 20
- 24 Olde Canal Way Unit 24