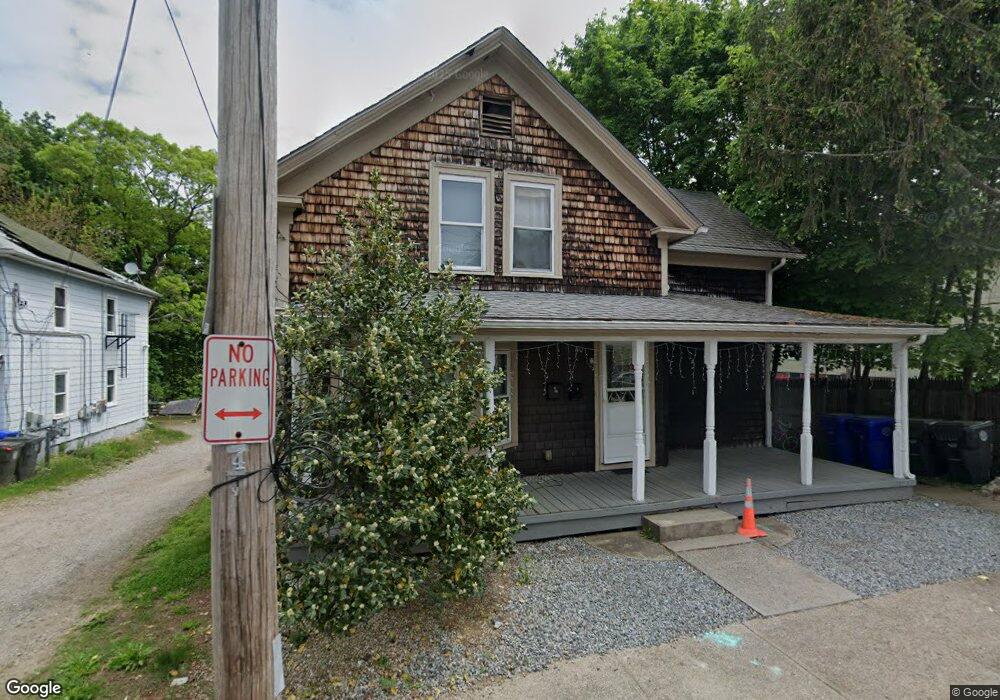
40 Epworth Ave West Warwick, RI 02893
Centreville NeighborhoodEstimated Value: $343,450 - $448,000
4
Beds
2
Baths
1,332
Sq Ft
$287/Sq Ft
Est. Value
About This Home
This home is located at 40 Epworth Ave, West Warwick, RI 02893 and is currently estimated at $382,863, approximately $287 per square foot. 40 Epworth Ave is a home located in Kent County with nearby schools including West Warwick High School.
Ownership History
Date
Name
Owned For
Owner Type
Purchase Details
Closed on
Jul 22, 2002
Sold by
Patenaude C A
Bought by
Verrier Richard E
Current Estimated Value
Home Financials for this Owner
Home Financials are based on the most recent Mortgage that was taken out on this home.
Original Mortgage
$118,960
Interest Rate
6.73%
Purchase Details
Closed on
Nov 8, 1996
Sold by
Lancellotta Luigi
Bought by
Patenaude Christopher
Home Financials for this Owner
Home Financials are based on the most recent Mortgage that was taken out on this home.
Original Mortgage
$44,100
Interest Rate
8.1%
Purchase Details
Closed on
Oct 17, 1996
Sold by
Bankers Turst Co Of Ca
Bought by
Lancellotta Luigi
Home Financials for this Owner
Home Financials are based on the most recent Mortgage that was taken out on this home.
Original Mortgage
$44,100
Interest Rate
8.1%
Purchase Details
Closed on
Oct 18, 1991
Sold by
Fleet Real Estate
Bought by
Secretary Veterans Aff
Create a Home Valuation Report for This Property
The Home Valuation Report is an in-depth analysis detailing your home's value as well as a comparison with similar homes in the area
Home Values in the Area
Average Home Value in this Area
Purchase History
| Date | Buyer | Sale Price | Title Company |
|---|---|---|---|
| Verrier Richard E | $120,000 | -- | |
| Patenaude Christopher | $50,000 | -- | |
| Lancellotta Luigi | $39,000 | -- | |
| Secretary Veterans Aff | $61,070 | -- |
Source: Public Records
Mortgage History
| Date | Status | Borrower | Loan Amount |
|---|---|---|---|
| Open | Secretary Veterans Aff | $121,000 | |
| Closed | Secretary Veterans Aff | $118,960 | |
| Previous Owner | Secretary Veterans Aff | $44,100 | |
| Previous Owner | Secretary Veterans Aff | $28,875 |
Source: Public Records
Tax History Compared to Growth
Tax History
| Year | Tax Paid | Tax Assessment Tax Assessment Total Assessment is a certain percentage of the fair market value that is determined by local assessors to be the total taxable value of land and additions on the property. | Land | Improvement |
|---|---|---|---|---|
| 2025 | $4,397 | $287,600 | $74,100 | $213,500 |
| 2024 | $3,934 | $192,200 | $47,100 | $145,100 |
| 2023 | $3,857 | $192,200 | $47,100 | $145,100 |
| 2022 | $3,796 | $192,200 | $47,100 | $145,100 |
| 2021 | $4,376 | $146,400 | $38,600 | $107,800 |
| 2020 | $4,376 | $146,400 | $38,600 | $107,800 |
| 2019 | $4,292 | $146,400 | $38,600 | $107,800 |
| 2018 | $4,712 | $120,200 | $36,300 | $83,900 |
| 2017 | $4,562 | $120,200 | $36,300 | $83,900 |
| 2016 | $3,106 | $120,200 | $36,300 | $83,900 |
| 2015 | $2,796 | $107,700 | $36,300 | $71,400 |
| 2014 | $2,735 | $107,700 | $36,300 | $71,400 |
Source: Public Records
Map
Nearby Homes
- 36 Epworth Ave
- 42 Epworth Ave
- 38 Epworth Ave
- 38 1/2 Epworth Ave
- 37 Epworth Ave
- 33 Epworth Ave
- 33 Epworth Ave Unit 2
- 34 Epworth Ave
- 28 Epworth Ave
- 44 Epworth Ave
- 29 Epworth Ave
- 31 Epworth Ave
- 43 Epworth Ave
- 32 Epworth Ave
- 48 Epworth Ave
- 50 Epworth Ave
- 1384 Main St
- 1390 Main St
- 1394 Main St
- 1400 Main St