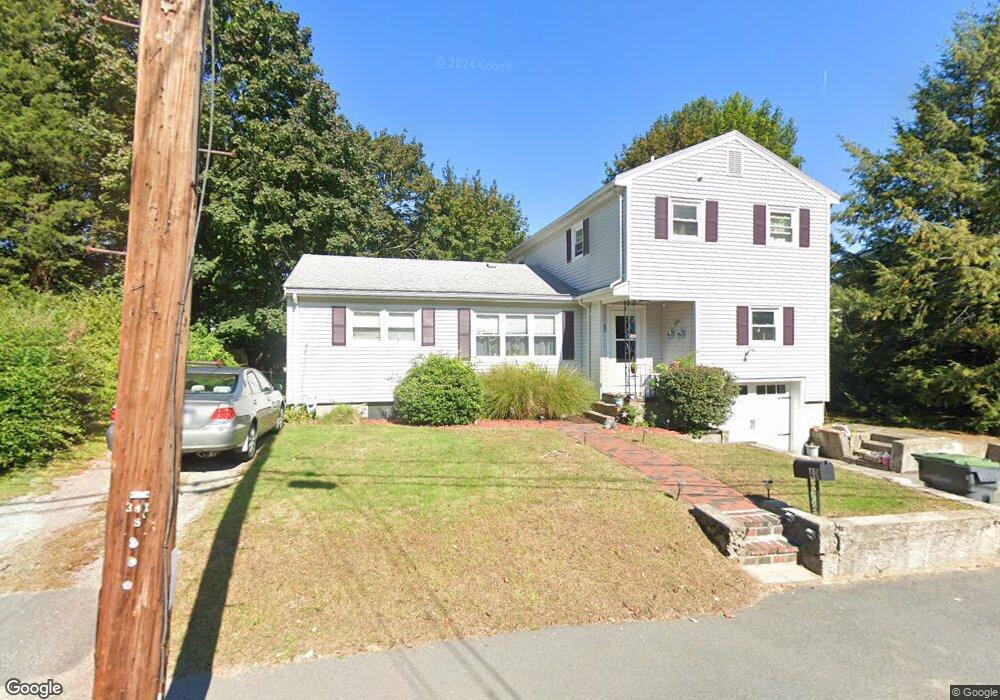
40 Fisher Rd Dedham, MA 02026
Riverdale NeighborhoodEstimated Value: $788,000 - $881,000
4
Beds
2
Baths
1,782
Sq Ft
$471/Sq Ft
Est. Value
About This Home
This home is located at 40 Fisher Rd, Dedham, MA 02026 and is currently estimated at $839,363, approximately $471 per square foot. 40 Fisher Rd is a home located in Norfolk County with nearby schools including Riverdale Elementary School, Dedham Middle School, and Dedham High School.
Ownership History
Date
Name
Owned For
Owner Type
Purchase Details
Closed on
Jul 30, 2001
Sold by
Johnson James S and Johnson Mary E
Bought by
Mahoney Patrick L and Mahoney Cheryl
Current Estimated Value
Home Financials for this Owner
Home Financials are based on the most recent Mortgage that was taken out on this home.
Original Mortgage
$220,000
Outstanding Balance
$86,004
Interest Rate
7.18%
Mortgage Type
Purchase Money Mortgage
Estimated Equity
$753,359
Purchase Details
Closed on
Sep 27, 1999
Sold by
Ciulla Joseph L
Bought by
Johnson James S and Johnson Mary E
Home Financials for this Owner
Home Financials are based on the most recent Mortgage that was taken out on this home.
Original Mortgage
$110,000
Interest Rate
8.1%
Mortgage Type
Purchase Money Mortgage
Create a Home Valuation Report for This Property
The Home Valuation Report is an in-depth analysis detailing your home's value as well as a comparison with similar homes in the area
Home Values in the Area
Average Home Value in this Area
Purchase History
| Date | Buyer | Sale Price | Title Company |
|---|---|---|---|
| Mahoney Patrick L | $295,000 | -- | |
| Johnson James S | $220,000 | -- |
Source: Public Records
Mortgage History
| Date | Status | Borrower | Loan Amount |
|---|---|---|---|
| Open | Johnson James S | $220,000 | |
| Previous Owner | Johnson James S | $20,000 | |
| Previous Owner | Johnson James S | $110,000 |
Source: Public Records
Tax History Compared to Growth
Tax History
| Year | Tax Paid | Tax Assessment Tax Assessment Total Assessment is a certain percentage of the fair market value that is determined by local assessors to be the total taxable value of land and additions on the property. | Land | Improvement |
|---|---|---|---|---|
| 2025 | $9,627 | $762,800 | $381,700 | $381,100 |
| 2024 | $9,294 | $743,500 | $351,300 | $392,200 |
| 2023 | $8,522 | $663,700 | $326,000 | $337,700 |
| 2022 | $7,911 | $592,600 | $298,200 | $294,400 |
| 2021 | $7,647 | $559,400 | $298,200 | $261,200 |
| 2020 | $7,473 | $544,700 | $285,900 | $258,800 |
| 2019 | $7,088 | $500,900 | $259,400 | $241,500 |
| 2018 | $6,917 | $475,400 | $233,900 | $241,500 |
| 2017 | $6,676 | $452,300 | $224,500 | $227,800 |
| 2016 | $6,086 | $392,900 | $199,600 | $193,300 |
| 2015 | $5,975 | $376,500 | $194,800 | $181,700 |
| 2014 | $5,863 | $364,600 | $194,800 | $169,800 |
Source: Public Records
Map
Nearby Homes