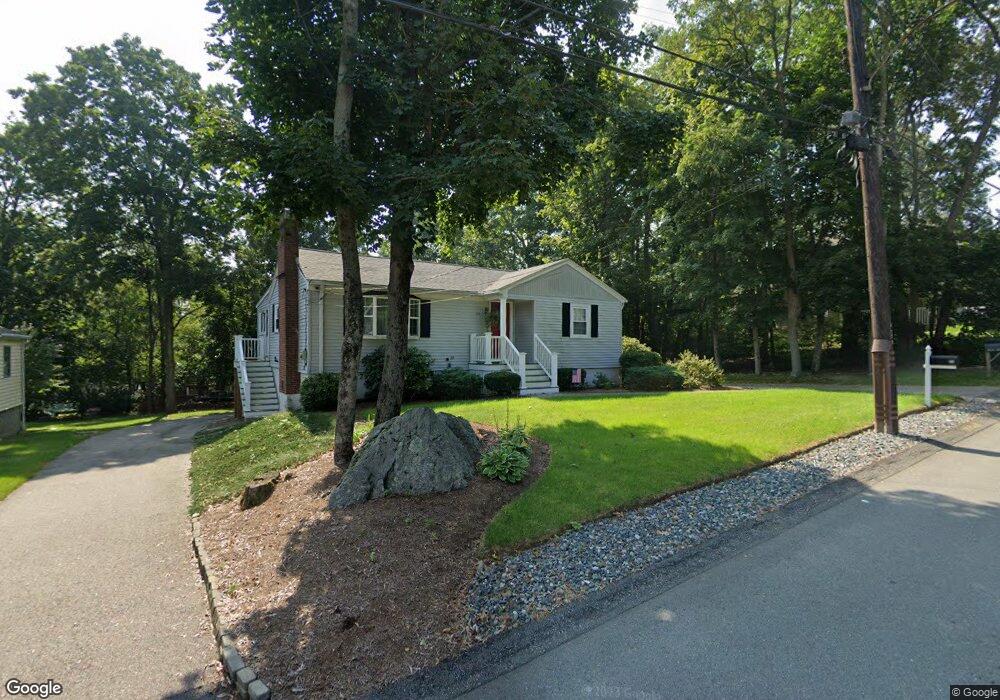
40 Fuller St Canton, MA 02021
Estimated Value: $619,241 - $712,000
3
Beds
2
Baths
1,310
Sq Ft
$514/Sq Ft
Est. Value
About This Home
This home is located at 40 Fuller St, Canton, MA 02021 and is currently estimated at $672,810, approximately $513 per square foot. 40 Fuller St is a home located in Norfolk County with nearby schools including Canton High School, St. John the Evangelist School, and Chabad Day School of School.
Ownership History
Date
Name
Owned For
Owner Type
Purchase Details
Closed on
May 26, 2023
Sold by
Quin Mary
Bought by
Quin Ft and Quin
Current Estimated Value
Purchase Details
Closed on
Apr 29, 2004
Sold by
Burak Albert and Burak Harriet
Bought by
Quin Mary
Home Financials for this Owner
Home Financials are based on the most recent Mortgage that was taken out on this home.
Original Mortgage
$125,000
Interest Rate
5.36%
Mortgage Type
Purchase Money Mortgage
Purchase Details
Closed on
Oct 16, 2003
Sold by
Gilman Arlene
Bought by
Burak Albert and Burak Harriet
Home Financials for this Owner
Home Financials are based on the most recent Mortgage that was taken out on this home.
Original Mortgage
$272,000
Interest Rate
6.43%
Mortgage Type
Purchase Money Mortgage
Create a Home Valuation Report for This Property
The Home Valuation Report is an in-depth analysis detailing your home's value as well as a comparison with similar homes in the area
Home Values in the Area
Average Home Value in this Area
Purchase History
| Date | Buyer | Sale Price | Title Company |
|---|---|---|---|
| Quin Ft | -- | None Available | |
| Quin Mary B | $400,000 | -- | |
| Burak Albert | $290,000 | -- |
Source: Public Records
Mortgage History
| Date | Status | Borrower | Loan Amount |
|---|---|---|---|
| Previous Owner | Quin Mary B | $125,000 | |
| Previous Owner | Burak Albert | $272,000 |
Source: Public Records
Tax History
| Year | Tax Paid | Tax Assessment Tax Assessment Total Assessment is a certain percentage of the fair market value that is determined by local assessors to be the total taxable value of land and additions on the property. | Land | Improvement |
|---|---|---|---|---|
| 2025 | $5,320 | $537,900 | $293,000 | $244,900 |
| 2024 | $5,157 | $517,300 | $281,700 | $235,600 |
| 2023 | $5,093 | $481,800 | $281,700 | $200,100 |
| 2022 | $4,959 | $436,900 | $268,300 | $168,600 |
| 2021 | $4,535 | $371,700 | $219,500 | $152,200 |
| 2020 | $4,331 | $354,100 | $209,100 | $145,000 |
| 2019 | $4,085 | $329,400 | $190,000 | $139,400 |
| 2018 | $3,858 | $310,600 | $182,700 | $127,900 |
| 2017 | $3,948 | $308,700 | $179,100 | $129,600 |
| 2016 | $3,979 | $311,100 | $184,500 | $126,600 |
| 2015 | $3,519 | $274,500 | $150,800 | $123,700 |
Source: Public Records
Map
Nearby Homes
- 399 Neponset St Unit 106
- 399 Neponset St Unit 408
- 399 Neponset St Unit 411
- 399 Neponset St Unit 309
- 399 Neponset St Unit 103
- 399 Neponset St Unit 105
- 399 Neponset St Unit 405
- 399 Neponset St Unit 301
- 399 Neponset St Unit 101
- 399 Neponset St Unit 310
- 399 Neponset St Unit 206
- 399 Neponset St Unit 202
- 399 Neponset St Unit 211
- 399 Neponset St Unit 209
- 399 Neponset St Unit 412
- 354 Neponset St Unit M
- 360 Neponset St Unit 702
- 346 Neponset St Unit F
- 59 Walpole St Unit 210
- 30 Coppersmith Way Unit 209
Your Personal Tour Guide
Ask me questions while you tour the home.