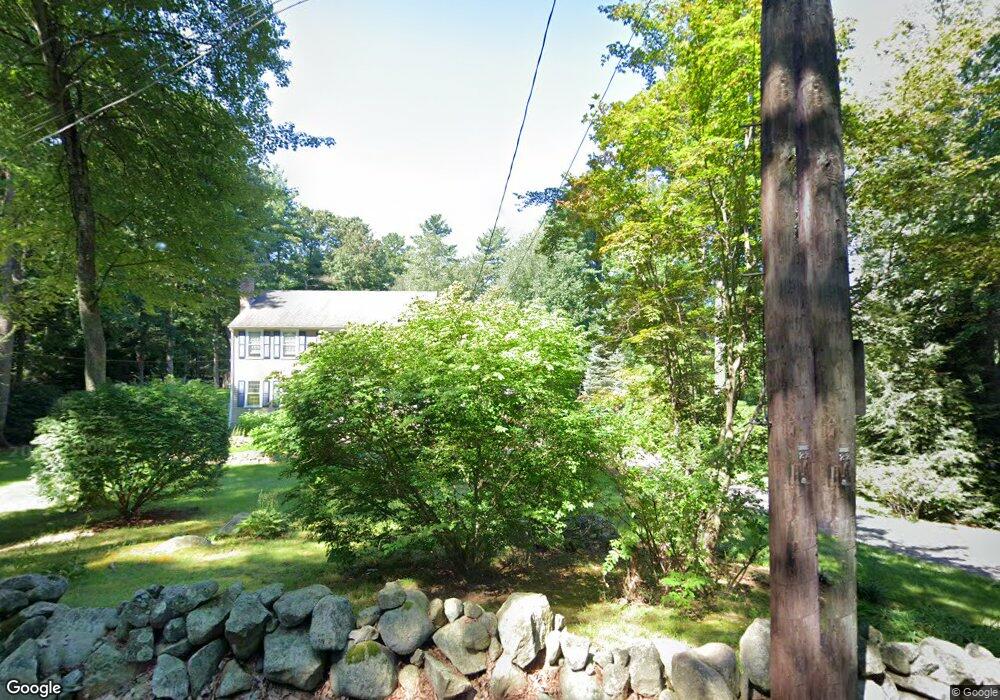
40 Granite St Medway, MA 02053
Estimated Value: $873,000 - $962,024
5
Beds
4
Baths
2,395
Sq Ft
$386/Sq Ft
Est. Value
About This Home
This home is located at 40 Granite St, Medway, MA 02053 and is currently estimated at $924,506, approximately $386 per square foot. 40 Granite St is a home located in Norfolk County with nearby schools including John D. McGovern Elementary School, Burke-Memorial Elementary, and Medway Middle School.
Ownership History
Date
Name
Owned For
Owner Type
Purchase Details
Closed on
Mar 29, 1996
Sold by
Glynn Charles W and Glynn Leslie A
Bought by
Goemaere Bertrand and Goemaere Julie A
Current Estimated Value
Home Financials for this Owner
Home Financials are based on the most recent Mortgage that was taken out on this home.
Original Mortgage
$208,500
Interest Rate
6.9%
Mortgage Type
Purchase Money Mortgage
Purchase Details
Closed on
Sep 1, 1993
Sold by
Glynn Charles W and Glynn Leslie A
Bought by
Ruthardt David and Ruthardt Nedra F
Create a Home Valuation Report for This Property
The Home Valuation Report is an in-depth analysis detailing your home's value as well as a comparison with similar homes in the area
Home Values in the Area
Average Home Value in this Area
Purchase History
| Date | Buyer | Sale Price | Title Company |
|---|---|---|---|
| Goemaere Bertrand | $278,000 | -- | |
| Ruthardt David | $395,000 | -- |
Source: Public Records
Mortgage History
| Date | Status | Borrower | Loan Amount |
|---|---|---|---|
| Open | Ruthardt David | $360,000 | |
| Closed | Ruthardt David | $240,000 | |
| Closed | Ruthardt David | $208,500 |
Source: Public Records
Tax History Compared to Growth
Tax History
| Year | Tax Paid | Tax Assessment Tax Assessment Total Assessment is a certain percentage of the fair market value that is determined by local assessors to be the total taxable value of land and additions on the property. | Land | Improvement |
|---|---|---|---|---|
| 2025 | $10,572 | $741,900 | $371,800 | $370,100 |
| 2024 | $10,683 | $741,900 | $371,800 | $370,100 |
| 2023 | $10,944 | $686,600 | $342,800 | $343,800 |
| 2022 | $10,510 | $620,800 | $266,300 | $354,500 |
| 2021 | $10,301 | $590,000 | $251,800 | $338,200 |
| 2020 | $10,404 | $594,500 | $251,800 | $342,700 |
| 2019 | $9,846 | $580,200 | $243,500 | $336,700 |
| 2018 | $9,803 | $555,100 | $235,200 | $319,900 |
| 2017 | $9,693 | $540,900 | $231,100 | $309,800 |
| 2016 | $9,602 | $530,200 | $200,900 | $329,300 |
| 2015 | $9,530 | $522,500 | $198,700 | $323,800 |
| 2014 | $9,414 | $499,700 | $198,000 | $301,700 |
Source: Public Records
Map
Nearby Homes
- 9 Tulip Way
- 12 Alder St
- 0 Farm St
- 20 Beechwood Rd
- 0 Old Log Lane (Farm St) Unit 73416329
- 30 Stone St
- 39 West St
- 16 Gray Squirrel Cir
- 359 Hartford Ave
- 462 Hartford Ave
- 455 Hartford Ave
- 5 Deerfield Rd
- 56 Fisher St
- 48 Black Bear Cir Unit 48
- 41 Black Bear Cir Unit 41
- 45 Black Bear Cir Unit 45
- 9 Black Bear Cir Unit 9
- 7 Black Bear Unit 7
- 5 Black Bear Cir Unit 5
- 3 Black Bear Cir Unit 3