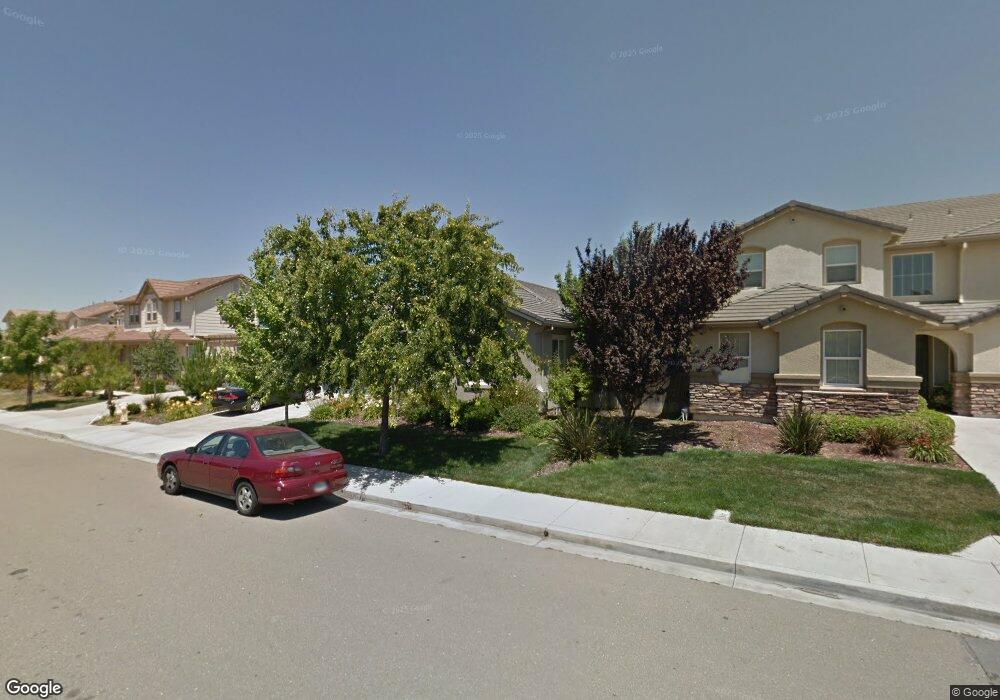
40 Gull View Ct Oakley, CA 94561
Estimated Value: $692,000 - $772,000
4
Beds
3
Baths
2,638
Sq Ft
$273/Sq Ft
Est. Value
About This Home
This home is located at 40 Gull View Ct, Oakley, CA 94561 and is currently estimated at $720,373, approximately $273 per square foot. 40 Gull View Ct is a home located in Contra Costa County with nearby schools including Iron House Elementary School, Delta Vista Middle School, and Freedom High School.
Ownership History
Date
Name
Owned For
Owner Type
Purchase Details
Closed on
Nov 11, 2019
Sold by
Huggins Brett M
Bought by
Huggins Vivian Ann
Current Estimated Value
Purchase Details
Closed on
Mar 22, 2013
Sold by
Huggins Brett M and Huggins Vivian Ann
Bought by
Huggins Brett M and Huggins Vivian Ann
Home Financials for this Owner
Home Financials are based on the most recent Mortgage that was taken out on this home.
Original Mortgage
$322,450
Outstanding Balance
$227,028
Interest Rate
3.49%
Mortgage Type
FHA
Estimated Equity
$493,345
Purchase Details
Closed on
Jun 10, 2008
Sold by
Kbone Llc
Bought by
Huggins Brett and Huggins Vivian
Home Financials for this Owner
Home Financials are based on the most recent Mortgage that was taken out on this home.
Original Mortgage
$345,100
Interest Rate
6.05%
Mortgage Type
FHA
Create a Home Valuation Report for This Property
The Home Valuation Report is an in-depth analysis detailing your home's value as well as a comparison with similar homes in the area
Home Values in the Area
Average Home Value in this Area
Purchase History
| Date | Buyer | Sale Price | Title Company |
|---|---|---|---|
| Huggins Vivian Ann | -- | None Available | |
| Huggins Brett M | -- | First American Title Company | |
| Huggins Brett | $375,000 | Chicago Title Company |
Source: Public Records
Mortgage History
| Date | Status | Borrower | Loan Amount |
|---|---|---|---|
| Open | Huggins Brett M | $322,450 | |
| Closed | Huggins Brett | $345,100 |
Source: Public Records
Tax History
| Year | Tax Paid | Tax Assessment Tax Assessment Total Assessment is a certain percentage of the fair market value that is determined by local assessors to be the total taxable value of land and additions on the property. | Land | Improvement |
|---|---|---|---|---|
| 2025 | $10,965 | $492,553 | $78,802 | $413,751 |
| 2024 | $10,636 | $482,896 | $77,257 | $405,639 |
| 2023 | $10,636 | $473,429 | $75,743 | $397,686 |
| 2022 | $10,479 | $464,147 | $74,258 | $389,889 |
| 2021 | $10,265 | $455,047 | $72,802 | $382,245 |
| 2019 | $9,877 | $441,552 | $70,644 | $370,908 |
| 2018 | $9,642 | $432,895 | $69,259 | $363,636 |
| 2017 | $9,522 | $424,407 | $67,901 | $356,506 |
| 2016 | $9,079 | $410,500 | $65,676 | $344,824 |
| 2015 | $8,856 | $386,000 | $61,757 | $324,243 |
| 2014 | $8,742 | $376,500 | $60,238 | $316,262 |
Source: Public Records
Map
Nearby Homes
- 369 Parkfield Way
- 53 Puffin Cir
- 208 Littleton St
- 809 Bluestone Dr
- 30 Vignola Ct
- 10 Da Vinci Ct
- 624 Brinwood Way
- 30 Renoir Ct
- 732 Westmoor Cir
- 22 Matisse Ct
- 629 Channel Cir
- 4736 Mammouth Ln
- 614 Channel Cir
- 618 Channel Cir
- 659 Channel Cir
- 671 Channel Cir
- 672 Channel Cir
- 464 Coolcrest Dr
- 1210 Quail Valley Run
- 279 Coolcrest Dr
- 30 Gull View Ct
- 50 Gull View Ct
- 4881 Snowy Egret Way
- 4883 Snowy Egret Way
- 4879 Snowy Egret Way
- 60 Gull View Ct
- 20 Gull View Ct
- 41 Gull View Ct
- 4885 Snowy Egret Way
- 4877 Snowy Egret Way
- 51 Gull View Ct
- 31 Gull View Ct
- 70 Gull View Ct
- 10 Gull View Ct
- 61 Gull View Ct
- 21 Gull View Ct
- 4875 Snowy Egret Way
- 4887 Snowy Egret Way
- 71 Gull View Ct
- 70 Sandhill Crane Ct
Your Personal Tour Guide
Ask me questions while you tour the home.